The health of the market's leading stocks, EMLX, JDSU, MSTR, etc., which are its lifeline, is the most important factor to look at when determining a market top. These leading stocks have fallen 30+%, and will need several months, years, or even longer, if ever to recover. These so called "New Economy Stocks" with no earnings or even a proven business model are being punished for their extreme, irrational valuations.
The next important factor to look at, is the health of the overall market. The one thing that I learned through investing, is to let the market tell the story. The Nasdaq has setup a beautiful Head and Shoulders pattern which is the most bearish and the most devastating pattern there is. On Feb 11th, the Nasdaq setup the first shoulder at 4300. On March 10th, the NASDAQ formed the head at 5200. And on April 7th, the NASDAQ formed the right shoulder at 4300. The confirmation of the pattern came on April 13 when the neckline, which was at 3750, was sliced through on heavy volume, like a hot knife through butter. We are currently at 3321, and based on recent history, the market looks poised to test the next support level at 2700. If we break the 2700 level, the composite will head further down to test the 2200 - 2400 levels. I won't even get into what will happen if the NASDAQ slices through the latter support level.
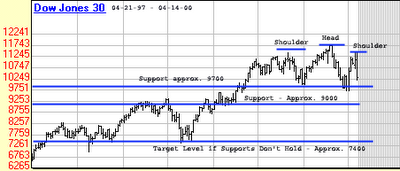
 The DOW, which was holding up better than the nasdaq because the stocks in it are considered safe havens during market turmoil, has also turned down. It is currently in the process of forming a huge head and shoulder pattern. The left shoulder occurred in December of 1999 between 11,200 - 11,300, the head formed on January 14th at 11,700, and the right shoulder recently occurred on April 7th. If the DOW breaks its neckline/support at 9700, it will most likely head down to test its support level at 9000. If 9000 is broken, it may make an attempt to test the 7400 level.
Another two important contrarian indicators to look at are the Bull/Bear and Put to Call Ratios. The Bull/Bear Ratio measures the amount of people that are Bullish and Bearish on the market. The higher the Bullish percentage is over the Bearish one, the more Bearish the indicator gets, and vice versa. The reasoning for this is, that if most people are Bullish, then they're fully invested, and don't have more cash to support current levels. Currently the Bull/Bear ratio is 58%/27% which is very Bearish.
The Put to Call Ratio measures the amount of Puts, people betting against the market, that are being purchased versus the amount of Calls, people betting that the market will rise. The reasoning behind this indicator is that 95% of all option players lose all their money (A proven fact). So if most people are buying calls, most likely they are wrong. This indicator can hang around at a low or high level for some time before the market turns in the opposite direction, but it's a good indicator that a short term market top or bottom may be around. Before today, the put/call ration was hovering under 0.5, which is very Bearish.
The last time people were this Bullish on the market was back in the 1920's, and we all know what happened then. Remember, the only way to make money in the market is to be patient, unemotional, let your winners run, but don't let the profit slip away, and cut your losses quickly. Go now, look at your portfolios, and decide which stocks need to be sold. Don't let the fact the you're losing money guide your decisions. If you're in cash when the market finally turns northward, you will have a chance to make money. But if you're still invested in some of the heavily beaten down stocks, it may be sometime before you ever see your original investment. Good luck in the weeks to come.
2 comments:
Very nice post! I wish I read blogs back then.
Very nice post! I wish I read blogs back then.
Post a Comment