Thursday, June 26, 2014

Market Distribution Joins Growing List of Sell Signals

The market has rallied despite uncertainty surrounding Ukraine, Iraq, the economy, and upcoming earnings. Price action has been impressive, shaking out early in the day and closing higher or at the high's of the day on most days, but below average volume has been a major concern. Over the last two weeks, volume has expanded, still below average, but the market has failed to make much progress. Most of the higher volume days have either stalled or turned into a distribution day, higher volume selling. The lead index, the SP 500, has experienced four to five distribution days over the last three weeks, a major warning signal.

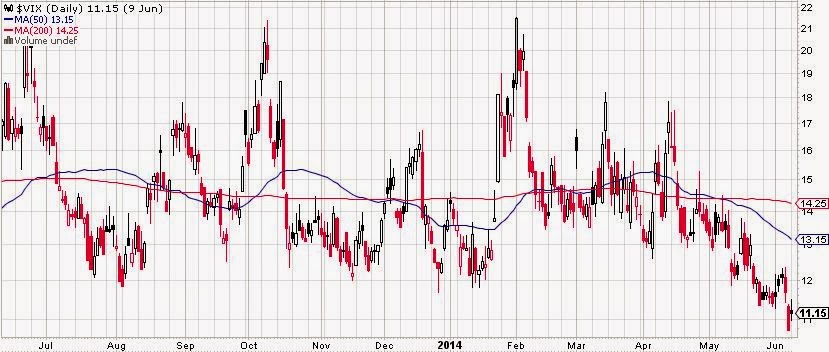
The NYSE advance/decline line continues to make new highs, but the fifty two week high low ratio has fallen despite the market trading at fifty two week highs...less stocks are participating in the upside. The VIX and bull bear ratios indicate extreme investor complacency, trading near bull market extremes. Interest rates have been falling and gold has been rising. A stealth attempt to rush to safety? 

Leading growth stocks have lagged the entire rally. They have shown signs of life on several occasions, but have failed to sustain any momentum. Value stocks have been the clear leaders and the market has behaved accordingly, choppy and difficult to make progress in. Early breakouts have either become over extended, exhibiting climactic action, or lack volume, with many failing to make much progress. Relative strength has failed to confirm many recent breakouts, and most are late stage, wild and loose consolidations.

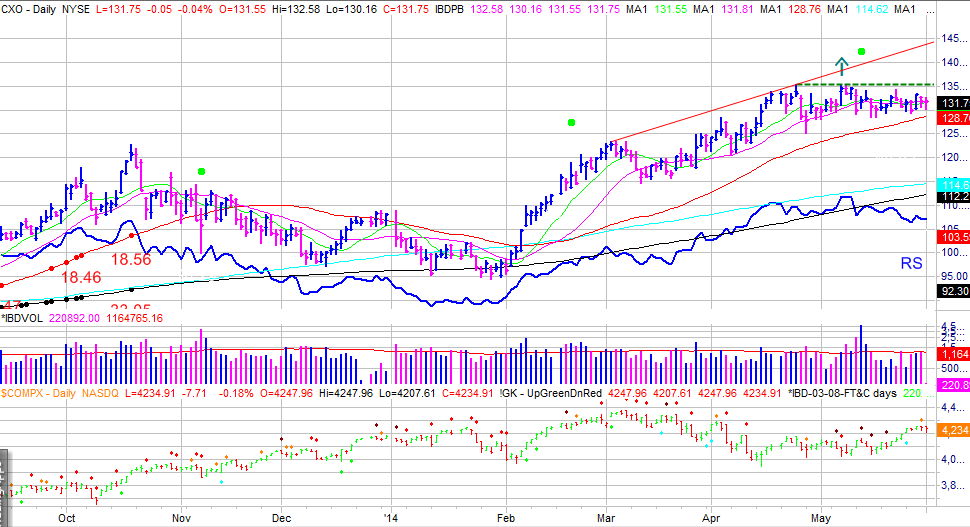
Netflix's (NFLX) handle has been wedging along the lows. Pacira Pharmaceuticals (PCRX) is a wild and loose, late stage breakout in weak volume. Celgene (CELG) broke out of a v-shaped cup and handle but the relative strength line has not confirmed. Hi-Crush Partners (HCLP) is extended historically and in the midst of a potential climax run, up over 25% in a few weeks after a long advance. Bidu (BIDU) and FaceBook (FB) have attempted to breakout from wild and loose cup and handle bases, but failed to make much progress and the relative strength lines are lagging. Home builders, Toll Brothers (TOL), Lennar (LEN), and Standard Pacific (SPF), have attempted to build cup and handle bases, but the relative strength lines have lagged and the consolidation are wild and loose. Oil and Gas stocks have been the clear leaders, Sanchez Energy (SN) and Pioneer Natural Resources (PXD).

The divergence between market direction and sell signals has become "normal" stock market behavior over the last year and a half, during rallies for short periods of time. But when the convergence begins, traders and investors had little time to react. Hard earned profits vanished and quickly turned into losses if traders hesitated to protect profits and minimize losses. 

The market is in a perfect position to frustrate longs and shorts at the same time, slowly killing them from over trading, a death by a thousand cuts. Traders should be extremely selective with new positions and hold only well behaving positions. Without hesitation, protect profits in over extended positions, and book minor profits or minimize losses in lagging stocks. Better safe then sorry with all the sell signals.

Friday, June 20, 2014

Trading Idea: The Priceline Group (PCLN) - Cup and Handle Base

The Priceline Group (PCLN) advanced over 80% since breaking out of a fifteen month cup and handle based in May 2013 and over 1,000% since the bear market bottom in 2009. The stock is currently forming a cup and handle base, which could be considered a late stage base depending on base reset rules (vary by strategy). The left side of the base is a bit wild and loose and volume barely materialized as the stock climbed up the right side, but there are several signs of support on the daily and weekly chart (high volume reversals, reverse churning, and tight closes). The stock may need to re-consolidate to tighten up, but should be considered on a breakout attempt.

Quarterly and annual sales and earnings growth are expected to grow 20%+ for at least the next five years. Margins are at their highest levels historically and expanding and return on equity has been consistently north of 30%. Expanding margins and strong sales growth has helped the company beat earnings 3.6%, 7.1%, 6.8%, and 12.9% over the last four quarters.

Positions can be initiated anywhere between here and the $1,300 handle high breakout. Protective stops should be placed below $1,180. Take the wild and loose, potentially late stage consolidation into account when managing the trade. Limit losses and expect improvement in price volume action as the stock advances or consider quick profit taking.

Our valuation model prices the stock around $1,430 over the next few months, and between $1600 - 1,837 (33 - 53%) over the next twelve to eighteen months if the company delivers steady growth with expanding margins.

Full Disclosure: No Position


Wednesday, June 18, 2014

Trading Idea: Western Refining Inc. (WNR)

Western Refining Inc. (WNR) advanced over 1,400% after breaking out of a bottoming base at the end of 2010 through the beginning of 2013. Over the last year, the stock has been digesting those gains and forming a flat base on top of a cup and handle. The recent flat base is the tightest structure in the entire year long structure. The relative strength line has been rising through the consolidation, but still needs to prove it can breakout to new highs along with the stock. Price action within the consolidation has been positive and favors accumulation. There have been several days and weeks with high volume reversals and volume diminished on down days/weeks. Indicating institutional support and lack of selling.

Quarterly sales growth has accelerated for three straight quarters from 0 - 70%, and are expected to grow over 20% in the next two quarters with annual sales growth at 24%. Earning's growth has been negative in recent quarters, but expected to accelerate to 93% over the next four quarters. The company has beaten earning's estimates three out of the last four quarters by 4%, -35.3%, 7.1%, and 10% respectively. Estimates have been revised higher over the last ninety days. Return on equity is 35% but falling margins could be a problem. The stock also yields 2.6%.

Our fundamental and technical valuation model values the stock between $60 - $80 (50 - 100% appreciation) over the next twelve to eighteen months if the market rallies and the company can keep surprising to the upside. Aggressive investors/traders can start initiating positions as the stock attempts to break out above the fifty day moving average, between $40 - 45. Protective stops should be placed around $38.

Full Disclosure: No Position


Monday, June 16, 2014

Trading Idea: Centene Corp. (CNC)


Centene Corp. (CNC) gapped out of a second stage cup and handle base on April 22nd, in volume 551% above average, after reporting stronger then expected earnings. The stock has run up 17% and is currently pulling back to the twenty day moving average, forming a three weeks tight base in quiet volume. A breakout above the base high around $76 would confirm further strength.

Quarterly sales growth has accelerated for two straight quarters, from 15% to 31% and is expected to continue accelerating for the next three quarters to 39%. Margins have doubled over the last four quarters and return on equity has accelerated from 6.8% to 15.1%. Accelerating sales growth and rapidly expanding margins lead to upside earnings surprises and higher stock prices. The company beat earning's estimates by 32% last quarter.

The twelve to eighteen month price target range is $112 - 134 (50 - 80%). Short term, the stock can trade above $80 if the rally continues. Protective sell stops should be placed between $70 - $71 to protect from a major loss.

Full Disclosure: No Position


Tuesday, June 10, 2014

Shortage of Sellers Explains Rally

Today was no different from any other day since the market starting rallying in May. A few frightening intra-day shakeouts reversed to close at the highs of the day. The DOW, SP 500, NYSE, and now the even the Nasdaq and Russell 2000, are within striking distance of new fifty two week highs. Price action of the indices has been positive and the NYSE advance decline line is confirming the strong price action by leading into new high ground. Unfortunately, below average trading volume is a major concern. It indicates that the rally is a result of a lack of sellers, rather then real buying.


Leading growth stocks have had a few good days here and there, but overall display major weaknesses. Most growth stocks remain unable to breakout or rally from below or off their moving averages, new consolidations are late stage or wild and loose with volume drying up as the stocks have attempted to rally to pivot points, and breakouts have failed to follow through, lack volume, or lag significantly. The handful of stocks that managed to follow through, come from groups and sectors considered value type safe havens because of their dividend yields...energy, healthcare, utilities, REITS, etc.

Based on the VIX and bull/bear ratio, traders and investors are extremely complacent. The VIX is at rally and eight year lows, and the bull/bear ratio is near the widest spread of the entire bull market.


This rally is like every other short rally we've had in the past year and a half. The market turns suddenly higher after a string of poor headlines, and proceeds higher almost unabated for a few weeks, only offering a few hours during intra-day shakeouts to initiate positions. But this time it is different. Volume has failed to confirm the indices strong price action, consolidations are later stage bases and wilder and looser, breakouts have failed to follow through significantly, lack volume, and/or relative strength, and investors and traders are extremely complacent...few calls for a pullback or correction. Trader's don't need to rush to cash, but with little profit cushion since the rally began, gains can turn to losses in one bad day. Review and tighten stops to protect profits and prevent major losses.

The exact timing of a correction is hard to predict, but with so many active warning signs, it wouldn't be surprising if the market started getting distributed once the Nasdaq and Russell 2000 join the remaining indices at new highs...the optimal area to trap the bulls and squeeze the shorts. The good news, the new highs by the NYSE advance decline line indicates that a major bear market is not in the cards, but a major correction that feels like the start of a bear market could be.

Monday, June 09, 2014

Trading Idea: Magnum Hunter Resources (MHR)

Magnum Hunter Resources (MHR) almost doubled in price after breaking out of a bottoming cup and handle base in August of 2013 in above average volume. The stock is currently forming a double bottom base on top of double bottom and handle base. The current base is much tighter and features stronger volume up the right side.

The company is in the hot oil and gas exploration group and drills in two of the hottest areas of the country, Marcellus and Bakken Shale. While the company is yet to turn a profit, sales growth has grown 100% over the last three years and expected to grow 30% over the next three. Rising oil prices and improving margins could lead to earnings surprises over the next few quarter and years.

A breakout above the $9.10 mid point of the double bottom base would be bullish for the stock. Aggressive traders could have entered the stock as it gapped up over the fifty day moving average, in well above average volume, or broke out above the short consolidation after the gap up.

Full Disclosure: Hold Position in MHR


Monday, June 02, 2014

Deceitful Market Difficult to Navigate

Below average volume in the indices, as the market rises, is a growing concern, but price action has been positive. Since the follow through day, there have been no distribution (high volume selling) days, so sellers aren't in a hurry to get out. The market has had some major intra-day shakeouts, but has closed positive or at the high's of the day, as volume rose, showing support. 

Leading growth stocks have been mixed. Many have been unable to muster much strength or follow through, but several have managed to breakout, move strongly up the right side of their cup shaped based in above average volume, and hold tight recent gains. An inability to follow through while the market rises would me a major concern. Smith and Wesson (SWHC) and Pioneer Natural Resources (PXD) broke out from flat bases on top of cup and handle bases and are still in a buyable  range. American Airlines (AAL) followed through on its recent breakout of of a cup and handle base in above average volume. Netflix (NFLX), Priceline (PCLN), NPS Pharmaceuticals (NPSP), and Lannett (LCI) continued to build the right side of their bases. Air Lease (AL), a frequent trading idea, has acted perfectly since the shakeout below the fifty day moving average.

A low volume rally can succeed over a short period of time. It allows leading growth stocks to build better bases, setup closer to more profitable breakout levels, and stronger to survive the next correction. But, they do not last long and have to be navigated cautiously.

Ultimately, a major correction or bear market in the indices, to reset and strengthen a new uptrend is preferred. Until then, the market will most likely continue the choppy trading environment. Traders need to stay very nimble and tight. Breakouts should not look back. If they do, consider booking gains or tightening stops to protect from major, even minor losses. Even if that means being shaken out or having to buy back. Protect capital until the risk reward environment improves. Choppy market environments have broken many investors and traders.

Full Disclosure: Hold position in PXD

Trading Idea: Concho Resources (CXO)

Concho Resources (CXO) more then tripled in price from its cup and handle breakout in 2009 and has spent the past three years digesting the gains. The stock attempted to breakout of a first stage cup and handle base in April.  Volume was anemic and the stock made little progress before settling into the current, tighter, flat base.

Quarterly sales growth has accelerated for four straight quarters from 30% to 40%. Annual sales and earnings growth are expected to accelerate from 27% to 34% and -9% to 53%. Net margins have expanded for four straight quarters from 9.8% to 12.5%. Accelerating sales growth and margins create the potential for major earnings surprises in the upcoming quarters.

Our initial price target is $170 with a potential PE expansion price target of $400. Investors and traders should be prepared to buy the stock as it surpasses the 135.33 pivot point. Aggressive traders could buy sooner if volume begins to pick up.

Full Disclosure: No Current Position