Monday, September 29, 2014

Bulls Hold On To Hope When They Should Fear

Bulls continue to hope this market will not correct and continue to rally. They point to the few positives in the market as a sign of strength and ignore the growing list of red flags that are signalling a deepening correction. Sure the market has ignored the growing number of geopolitical conflicts, but have they really?

Since the beginning of July when the market ended its last strong rally, distribution, stalling, and churning, have increased dramatically. Rally days and weeks have come on anemic, below average trading, and when volume has spiked to above average levels, rarely was it ever higher then the preceding down days.

The NYSE advance decline line lagged the most recent rally into new highs, and the NASDAQ advance decline line never even came close to new highs. Both advance decline lines have been on a steady decline into new lows despite several strong price days in the market.

Volatility has increased significantly over the last few days with no end in sight. Despite several rally attempts, the VIX has been on a steady uptrend for several months. While some consider this a sign of capitulation, price has not confirmed. Capitulation occurs after several weeks of selling and a steady decline in volatility as a new rally is attempted.

Leading growth stocks have completely ignored any strength in the market. The majority have sliced through their fifty day moving averages in heavy volume, recent breakouts have failed, and the one's that can be characterized as holding up, are wide and loose. Few are in bearish formations indicating a major bear market is around the corner, but that takes months to take shape. There are a few stocks that continue to defy the heavy market distribution, but I call those distractor stocks that give bulls hope to hold on. GoPro (GPRO), a recent hot IPO, continues to make new highs in heavy volume.

Short trading ideas have started to break down, but have been tough to hold during the recent increase in volatility. Traders need to stay patient with these positions as few have given any reason to panic or triggered protective stops. Many new setups continue to tighten within consolidations and secondary entry points. 3D Systems (DDD), Pentair (PNR), Gulfport Energy (GPOR), Covance (CVD), Avon Products (AVP), and Arch Coal (ACI), are following through on recent breakdowns off their respective fifty day moving averages.

There is no indication of impending bear market, but a major correction is clearly in the cards. Long only traders should be in cash and looking for a place to vacation, but not forget to keep up with their research, just in case. Aggressive traders should be holding several short positions looking to add or initiate additional positions.

Full Disclosure: Positions in DDD, PNR, GPOR, CVD, AVP


Friday, September 26, 2014

Industrial Manufacturing Company on Verge of Another Breakdown - Pentair $PNR

Pentair (PNR) broke down from a bearish head and shoulder pattern, July 31, 2014, on a poor earning's report. The company missed both sales and earning's estimate and guided lower. Since then, the stock has attempted to rally back to the fifty day moving average and head and shoulder neckline two times, but both attempts were in low volume.

Accelerating margins over the last four quarters are about the only thing good going for the coming, but revenue misses have led to decelerating earnings growth. Ruining the potential of accelerating margins. The company has missed analysts estimates for two straight quarters and estimates have been coming down significantly ever since. Three year sales growth is expected to decelerate from 35% to 1% and earnings growth is expected to stay steady at around 16%, but decelerate over at least another quarter to 9% from 83% three quarters ago.

The stock can be shorted as it breaks below the recent range between $66.00 and $66.25 with a tight stop just above recent highs around $67.30.

Full Disclosure: Hold Position


Tuesday, September 23, 2014

Chinese Discount Retailer Could Defy Market Downtrend - Vipshop Holdings $VIPS

Vipshop Holdings (VIPS) has been one of the market's biggest winners, advancing almost 3,500%, since breaking out of it first stage, cup shaped based the week of September 21, 2012. Since topping the week of August 15, 2014, the stock has pulled back to the fifty day moving average, closing tight over the last three weeks along the fifty day moving average with a high volume positive reversal last week. The current consolidation is a later stage base and carries a higher risk of failure. But, despite the market's three day sell off, the stock has held up quite well, rallying over four percent in higher volume today.

From a fundamental perspective there is very little to dislike. Margins have improved from -1.4% to 3.5% over the last seven quarters and return on equity is a solid 40% and rising. The company has beaten analyst's estimates over the last four quarters by 23.8%, 19.5%, 31.3%, and 12.5%, respectively, and analyst continue to raise quarterly and annual estimates. Sales and earnings are expected to grow by 65% and 105% over the next three years, respectively, after growing well over 200% over the previous three years.

Based on current valuations and expected growth rates, the stock could trade up to $300 by the end of the year, and more then double to $500 over the next twelve to eighteen months. Traders should consider entering the stock as it breaks out above the current downtrend line around $211. Protective stops should be placed at $195 initially, and tightened as the stock follows through. Keep in mind, the late stage nature of the base and current market correction could throw cold water on any breakout attempt.

Full Disclosure: No Current Position


The Greatest Trick The "Bear" Ever Pulled Was Convincing The "Markets" It Didn't Exist

The market sold off for a second straight day yesterday after marking new highs last Thursday, but volume was lower. This was little consolation as comparisons to Friday's quadruple witching volume were difficult and volume was still higher then almost every other up day during the rally except for one, continuing the trend of higher volume down days and lower volume rally days. Even though the day wouldn't officially be considered a distribution day, over the last twenty trading days the Nasdaq, SP 500, and Dow, have registered six, eight, and seven distribution or stalling/churning days, respectively.

The NYSE and NASDAQ advance decline lines failed to confirm the indices new highs and have been leading them lower. While the NYSE advance decline line did manage to make new highs during the rally, the NASDAQ advance decline line did not, and is on the verge of confirming a second leg down. 

The small cap indices which led the market lower during the last correction, failed to follow the larger cap indices into new high ground during the recent rally, and are now rolling over near their fifty and two hundred day moving averages for a second leg lower.

The majority of leading growth stocks lagged during the rally and are now breaking down below their fifty day moving averages in above average volume. It is very important to keep in mind that leading growth stocks should not be holding tight or bouncing off their longer term moving averages while the market rallies higher. Even though it seems constructive, it is not and a sign of underlying distribution. Baidu (BIDU), Netflix (NFLX), Tesla Motors (TSLA), and Under Armour (UA) are all starting to break their fifty day moving averages and falling below recent pivot points in above average volume.

Recent short trading ideas 3D Systems (DDD) and Gulfport Energy (GPOR) rolled over at their fifty day moving averages, while Altisource Portfolio Solutions (ASPS) continues to consolidate around its fifty day moving average. Even Yahoo (YHOO), as expected, sold off hard after the Ali Baba (BABA) IPO opened for trading. Review the updated list of short trading ideas to prepare for further downside.

The Capitalist Bull has warned over the last few weeks that traders need to protect their profits and cut out all lagging, especially losing, positions. The market's move into new high ground was the final bull trap frustrating the bears and keeping the bulls complacent. By now, most traders should be in cash with a short position or two as the trend turns lower and a correction takes hold. Few stocks are worth holding through a correction. The only stocks a trader should consider holding through a correction are those that were bought out of first or second stage consolidations and have signifcant gains that can withstand a correction. 

Expect the indices to gyrate wildly as they approach and undercut their respective fifty day moving average and recent consolidation lows. Long only traders can go on vacation for at least the next week or two to avoid being trapped into the market on false rally attempts.

Thursday, September 18, 2014

High Yielding Fertilizer Stock Readies New Uptrend - Potash Corporation of Saskatchewan $POT

Potash Corporation of Saskatchewan (POT) advanced over 2,200% from its first stage breakout the week of July 25, 2003 to its peak the week of June 20, 2008 and crashed along with the market during the financial crisis. The stock ran up 400% from its financial crisis low, only to sell off over 50%, but in a more orderly fashion, forming a multi-year bullish descending wedge. Potash has managed to breakout above the descending wedge and is currently forming a tight cup shaped base with plenty of accumulation just above the descending wedge.

Industrial companies like Potash tend to see their stock prices advance ahead of good fundamentals, but there are usually clues. The company has significantly beaten analysts estimates the last two quarters by 14.3% and 21.7%, respectively, and analyst have been raising estimates. Margins have shrunk for two straight years, but return on equity is a respectable 19%. Sales and earnings growth have been negative, but are expected to turn positive over the next few quarters and years. The dividend has increased for the last five years and now yields approximately 4.1%.

If Potash can improve pricing power, which will lead to higher margins, it can continue to delivering earning's surprises that will carry the stock higher. Investors and traders have to be patient over the next few days and allow the stock to digest the recent multi-day spurt, and consider entering the stock as it breaks above the recent high of $36.67, with a initial protective stop at recent lows around $33.42. Depending on the pullback, the stock could produce a tighter entry on the pullback. There is a lot of overhead supply for the stock to work through, but the stock should be able to run to the high of the cup shaped base of around $38 over the near term, and into the $45 - 60 range over the long term. Tighter stops can be used once the stock breaks out.

Full Disclosure: No Current Position


Tuesday, September 16, 2014

Financial Services Stock Susceptible to Further Downside on Fed Announcement - Altisource Portfolio Solutions (ASPS)

Altisource Portfolio Solutions (ASPS) broke out of a cup and handle base the week of October 28, 2011 and advanced 550% to its peak the week of December 6, 2013. The company benefited tremendously from lower rates and quantitative easing. Now that the easy money era is coming to a close, institutions have been busy selling off the stock.

Despite continued strong quarterly/annual sales and earnings growth, significantly beating analyst's estimates for three straight quarters, and higher analyst revisions, the stock was down over 50% from its peak after breaking down below it bearish head and shoulder neckline the week of August 8, 2014, but rallied back in below average volume to test its fifty day moving average and bearish head and should neckline along with the market the last few weeks. Keep in mind, historically, big winners like Altisource Portfolio Solutions (ASPS), tend to sell off well ahead of any major signs of growth problems become obvious to the general public and even the majority of analysts.

The stock can be shorted as it stalls at these levels and breaks below the neckline at around $97.44 in heavy volume, with protective stops initially just above $106. Conservative short sellers should wait to see how the stock reacts to tomorrow's Fed announcement before attempting a short position. Initial expected downside target would be $80 just below the fifty week low, and potentially as low $60 - 67, the next major support area.

Full Disclosure: No Current Position


Friday, September 12, 2014

Oil/Gas Exploration/Production Company Poised For Further Downside - Gulfport Energy (GPOR)

Gulfport Energy (GPOR), an oil and gas exploration and production company, advanced over 5,000% from its 2009 Financial Crisis low of $1.50, and almost 500% from its 2012 low of $15.79. The stock peaked on April 4th, 2014 at $75.75 and sold off off 32% to its August 1st, 2014 low of $51.59. It has spent the past six weeks pulling back to the fifty day moving average on diminishing, below average volume. A similar consolidation to the July 2014 roll over at the fifty day moving average that saw the stock fall just over 20% as it broke through the neckline of its bearish head shoulders consolidation in increasing volume.

The company is expected to grow sales and earnings by around 60% over the next three years, but has significantly missed analyst's estimates for three straight quarters by 72%, 5%, and 53%, respectively. Analysts have continuously lowered their estimates over the last ninety days, throwing doubt on those expected growth rates. Operating margins and return on equity have fallen for six straight quarters.

The stock can be shorted over the next few days as it continues to stall at the fifty day moving average around $57.56, or as it breaks the $55.50 - 56.00 range. Protective stops should be placed just above $59 initially. Our downside target is in the range of $46 - 50 (13 - 20%).

Full Disclore: No Current Position


Wednesday, September 10, 2014

3D Printer Maker on Verge of Breakdown - 3D Systems (DDD)

3D Systems (DDD), one of the bull market's biggest winners, advanced over 2,700% after breaking out of a first stage cup and handle base the week of December 4th, 2009. The stock topped at $97.28 the week of January 3rd, 2014 and has been in the process of forming a head and shoulder top. The stock had a false breakdown below the neckline the week of April 11th, 2014, and has spent the past nine months testing the neckline as the market has rallied higher. Each attempt over the neckline and fifty day moving average has come in below average volume (weeks May 30th, 2014, September 5th, 2014, and currently) or stalled (week of July 4th, 2014).

The company missed analysts earnings and sales estimates for the recent quarter and guided lower. Margins have contracted for six straight quarters from 11.2% to 6.1% and return on equity has fallen below 10%.

Traders could attempt to start shorting the stock as it starts stalling around the fifty day moving average around $52.94 and breaks back down below the moving average. Protective stops should be placed just above the thirty day high, currently $54.24, or whatever high the recent multi-day rally establishes. Downside target range is between $36 - 40 (24 - 35% approximately), which also coincides the average big winners fall after topping.


Poor Price Volume Action Plagues Market and Leading Growth Stocks

As the end of July approached, the market, finally, seemed to be headed for an overdue correction. Instead, it found support at or near the 50 day moving average the first week of August and began to rally. Unfortunately, volume failed to materialize as the indices climbed and broke out to new fifty two week and all time highs. This could easily have been forgiven as August rallies tend to be on low volume and have worked in the past, but as traders returned from summer vacations and volume picked up, the indices began to churn, get distributed, and stall. The NASDAQ, the lead index has suffered two, well above average and the highest volume since the rally began, distribution days in the last five days, while the DOW and SP 500 have suffered four and five distribution days, respectively, in the last ten days. The small caps which led the market to the downside, failed to follow the other indices into new highs and quickly came under distribution as it squeezed back above its fifty and two hundred day moving averages, potentially setting up a second leg lower.

Large cap growth stocks, Facebook (FB), Chipotle Mexican Grill (CMG), Baidu (BIDU), Biogen Idec (BIIB), Under Armour (UA), and Polaris Industries (PII), gapped out of bases, in well above average volume, on strong earning's reports ahead of the market's rally attempt. Exactly the type of action expected ahead of a strong rally and it appeared that another round of growth stocks were readying to finish up consolidations and breakout soon after. Unfortunately none of these stocks were able to follow through and started to stall or run out of steam (low volume) almost immediately after their respective gap ups. The handful of stocks that did manage to follow through, Bitauto (BITA), Avago Technologies (AVGO), Silica Holdings (SLCA), Emerge Energy Services (EMES), Gilead Sciences (GILD), and Pacira Pharmaceuticals (PCRX), went into climax runs and are starting to break from those highs in heavy volume. The majority of recent breakouts, Navigator Holdings (NVGS), Autohome (ATHM), G-III Apparel Group (GIII), Hi-Crush Partners, LP (HCLP), Gramercy Property Trust (GPT), Netflix (NFLX), and The Priceline Group (PCLN), either failed to follow through, failed, or are on the verge of failing within days of breaking out. Any remaining consolidations are too wide and loose and have lagging relative strength lines.

Two NASDAQ distribution days could be forgiven if it were not for the poor price volume action of the early leaders and recent breakouts, and the growing distribution count for the DOW and SP 500. Traders should have been stopped out of at least some of their bigger winners and ALL of their lagging positions. Any remaining positions should have stops tightened further. As every other short rally this past year, by the time leading growth stocks start to show real damage and market distribution reached dangerous levels, portfolios as a whole give up most, if not all of their gains within the first few distributions days even though traders were able to catch one or two of the bigger winners. 

Stay long at your own risk. There are too many major red flags in the market to ignore. At a minimum, get off margin. Conservative investors are better off in cash.

PS

Read the past few market updates for more red flags. http://capitalistbull.blogspot.com/search/label/Market

Monday, September 08, 2014

Bitauto Holding's (BITA) Climax Run Ready for Final Spike Higher

Bitauto (BITA) has advanced over 1,800% since breaking out of a first stage cup and handle base the week of November 2nd, 2012 and over 100% since breaking out of the most recent, later stage, cup and handle base the week of June 20th, 2014. By all measures, the stock is in the midst of a climax run and has pulled back on lower volume to the ten day moving average and formed an inside week setting up one more spike higher on a breakout above $98.28. 

Traders can start entering the stock between current levels and $95 with a protective stop no lower then $89, aggressively, or $91 - 92, conservatively. Consider taking profits between $100 - 120 as it starts to stall or has its biggest daily gain in the last year (approx 10%+). This position should be taken as a trade only and not as an investment. It will most likely last no more then a few days as the the Ali Baba (BABA) IPO hype builds.

Full Disclosure: Hold Position


Friday, September 05, 2014

Yahoo's (YHOO) Bearish Head and Shoulder's Base Ahead of Ali Baba (BABA) IPO

Yahoo (YHOO), originally featured in Short Trading Idea: Yahoo (YHOO) Reminiscent of 3COM (COMS), continues to form the right shoulder of a bearish head and shoulder pattern ahead of Ali Baba's (BABA) IPO. Currently expected sometime early this month. The consolidation could be viewed as a bullish cup and handle base, but the pattern is a later stage base, wider and looser then any other consolidation in its entire run, and each rally attempt over the fifty day moving average has either stalled or been in below average trade. Increasing the likelihood of a rollover.

Fundamentally, outside of the cash the company will receive from the Ali Baba (BABA) IPO, already priced in, sales and earning's growth are projected to be negative over the next three years. Even with the new cash pile from the IPO, the company has failed to prove that any of its recent acquisitions will contribute to the companies top and bottom line growth in any significant way. Margins have been shrinking and returns on equity is a poultry 10%...very low in comparison to the stronger internet companies.

Yahoo (YHOO) has lost its 1990's glory of being the internet king to the likes of Google (GOOG), Facebook (FB), Twitter (TWTR), and even Microsoft (MSFT). Without any real growth, Yahoo (YHOO) will rollover from these levels and ultimately retrace most, if not all, of the stocks 254% advance over the last two years on the Ali Baba (BABA) hype. Aggressive traders could begin shorting the stock up at these levels with conservative investors waiting for the day of the Ali Baba (BABA) IPO opens for trading. Protective stops should be placed near recent highs around $39.60. The biggest risk to shorts is the uncertain timing of the Ali Baba (BABA) IPO. But like 3COM's (COMS) last hurrah before the Palm (PALM) spin off, Yahoo's (YHOO) days are numbered.


Wednesday, September 03, 2014

Leading Growth Stocks Stagnant and Wild Despite Relentless Market Up Trend

While the market has persistently risen over the last four weeks, the majority of breakouts have stagnated, and the handful that have followed through are exhibiting climactic, wild, or stalling action. Intra-day trade is extremely volatile among leading growth stocks, with major retracements of strong opening moves more then a few times a week, and almost every new base is a late stage, wide and loose consolidation with a lagging relative strength line.

During strong rallies, at least one out of every three positions makes significant enough progress to wash out the small losses incurred on the positions that do not. In today's market, it has been difficult to contain losses, with slippage, to under two to three percent, and only a handful of breakouts have been able to follow through, even five percent, with gains being wiped out in a day or two on pullbacks or trade failures.

The growing danger for traders is a death by a thousand cuts. If the market begins registering more stalling and distribution days, sell offs in profitable positions could lead portfolios into the red quickly with so many small losses and little profit cushion up to this point. Traders have no choice but to limit any new positions and consider tightening stops, to protect profits and minimize losses, with so many setups failing to follow through and leading to a greater number of failures and small losses, wiping out even a decent move by one or two stocks. More risk averse traders could even consider moving to mostly cash. I know this is beginning to sound like a broken record opinion, but the reality on the ground is, unless traders have been long just the indices or were near perfect in their stock selections, few have made any progress in the last four weeks holding positions longer then a day.

The trading action exhibited by leading growth stocks is more indicative of underlying distribution and an intermediate top, then a setup for a strong continuation higher. It appears for now that the market and a handful of stocks may have some room to follow through higher despite all the red flags. Do not overstay the welcome. Better to be the first one out, then be trampled over running for the exit.

Lululemon Athletica (LULU) Poised For Further Downside

Lululemon Athletica (LULU), once a Wall Street darling and high flier, advanced over 3,800% from it 2009 lows, but has traded down over 55% since peaking at 82.50 in June of 2013. Margins have decelerated for five straight quarters, and sales and earnings growth which averaged over 30% consistently, are now expected to barely average 10% growth over the next three years. The company has beaten significantly downward revised estimates in each of the past four quarters, but analyst continue to revise future estimates lower despite those beats.

The stock is fairly valued at these levels if the company can slow down the deceleration of growth. If not, the stock could trade down to the mid 20's on another poor earning's report. A breakdown below the fifty day moving average around $39.50 - 40.00, in heavy volume, could signal another wave down for the stock. Protective stops should be placed around $42. Keep in mind, the stock is already down significantly and is susceptible to a major squeeze on news of better margins or a pick up in sales or earning growth.

Full Disclosure: No Current Position


Monday, September 01, 2014

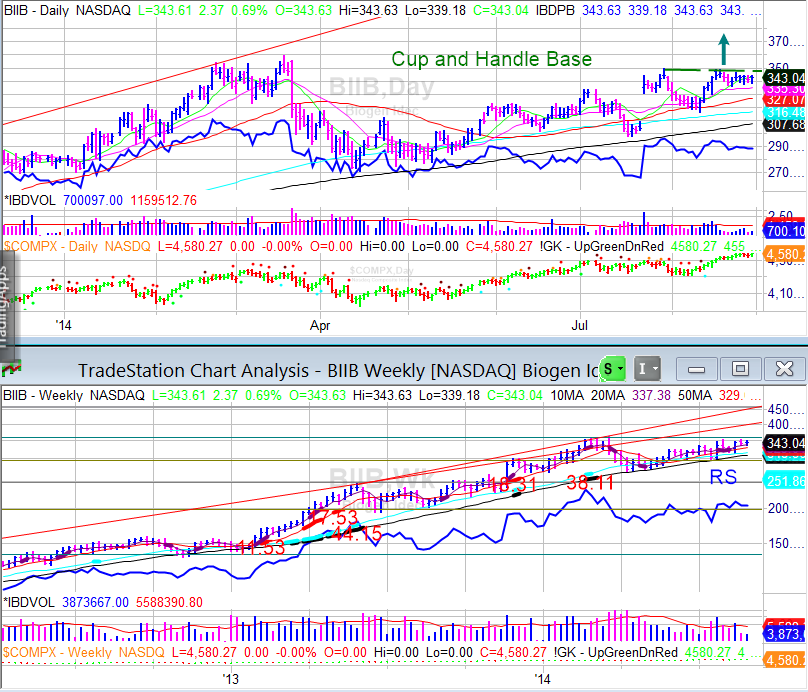
Biogen Idec (BIIB) Cup and Handle Sets Up Possible Climax Run

Biogen Idec (BIIB) has advanced over 600% since breaking out of a first stage cup and handle base the week of 10/29/2010. The stocks is currently forming a wide and loose, fifth stage (higher probability of failure), cup and handle base with tighter trading in the handle, in diminishing volume. 

Sales growth has accelerated from 6% to 41%, and earnings from 21% to 52%, over the last eight quarters. Over the last three years, sales and earnings growth have averaged 14% and 21%, respectively, and are expected to average 20% and 31% over the next three, respectively. Return on equity has averaged 23%+. The company has beaten analyst's estimates three out of the last four quarters, and by 23% in the last quarter. Year over year sales are expected to decelerate to 9% over the next three years and margins have contracted in the last two quarters, year over year. Possibly two early signs of potential earnings problems to come.

The stock reached its PE expansion price target range of $170 - 200 in early 2013 and has advanced another 100% since. Stocks that exhibit such power have a higher probability of experiencing one final climax run. Based on current valuations, the stock could advance another 20% ($420) in the short run on a breakout above $349, and 40 to 50% ($489 to $525) in a climactic move by year end. Protective stops should be placed around $317 initially, and tightened to $337 if the stock exhibits poor price volume action after the breakout.

The late stage base, decelerating margins and estimated year over year sales growth, significantly increases the risk of failure. Treat the position as a trade, not a long term investment.

Full Disclosure: No Current Position