Here is a great example of why all the research in the world wouldn't have clued you in to the earnings warning to come from KLIC on 8/3. But looking at the chart, you would've realized that something fishy was going on.
Looking at the weekly chart below, the stock broke out of a year long cup and handle pattern, and went on to move 124% over the next three months before topping out with the rest of the market in March.

The stock was also part of the strong semiconductor equipment group, which almost every analyst on the street was touting the strong fundamentals, and how the cycle of growth would continue into at least next year. But what do they know?
If you were lucky enough to ride the stock out of the cup and handle, good, but if you didn't get out, you're sitting on a nice loss, bad!!
So how would you have know to get out? Volume wasn't much of a factor in this chart. If you look at the move up or even down early on there wasn't much distribution. The two big days of distribution days on 3/16 and 4/4 were more like accumulation days, as the stock recovered from major sell offs those day to close in the upper range of the day.
Confused yet? Well, good, then your learning that you need to add other sell indicators to your arsenal. In this case the drop below the 50 day moving average on 3/14 should've gotten you out of the stock. If you were stubborn and didn't get out you probably swallowed your heart over the next few days as the stock fell all the way down to 20, the breakout level of the cup and handle pattern, before reversing higher. At that point you were thanking god that the stock began to move higher. The stock proceeded to power through it's 50 day moving average on higher volume. So you thought you were out of the woods, and were able to pick up those cocktail party discussions. Ha!!! Boy were you wrong. The stock continued higher for a few more days but on absolutely no conviction, and then crashed through the 50 day moving average on heavy volume. If you didn't get out here then you were asking for trouble, as the stock tested the $20 level again. At this point a descending triangle began to form. If you at least recognized this bearish pattern forming, you still could've gotten as the stock tested the upper range of the triangle and the 50 day moving average several more times, and failed to break throughor hold above. OK, if you're still in the stock, then the break through the 200 day moving average on 7/21 should've been a final warning that you should take your profit and run.
At this point emotion begins to take over. Traders start to question their selling ability. The most common thought, it's down so far, it can't possibly go lower considering it's in a strong sector. Well, if you were paying attention to the SOX index, you would've realized that the sector the stock was in was on the verge of breaking down itself (Read the 7/31 Stock of The Week, where MB. featured this potential breakdown).
So what's the conclusion? Somebody obviously knew something we didn't know. This was a well orchestrated distribution, as volume didn't clue us in. But the constant breakdown below the 50 day moving average, was a good sign that the institutions were up to no good. This level and the 200 day, are usually where the institutions like to do their buying and selling. So the warning on August 3rd shouldn't have been to much of a surprise. You had plenty of opportunities to get out, hopefully you took them. If not, learn from this experience and don't make the same mistake again.
Good Luck!!
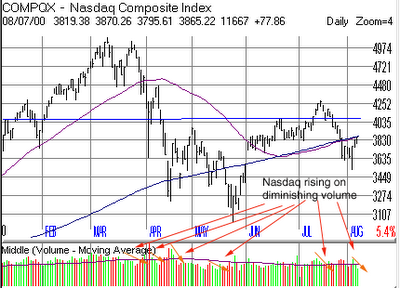 Also interesting, the short ratio topped out almost at the same time the market started to rally in early June. Enforcing the idea that the current rally was nothing more then a short squeeze. The bull/bear and put/call ratios also never saw the extremes that these ratio exhibits when firm bottoms are made, and the DOW and NASDAQ are below their 200 day moving averages.