Showing posts with label Short. Show all posts

Friday, September 26, 2014

Industrial Manufacturing Company on Verge of Another Breakdown - Pentair $PNR

Pentair (PNR) broke down from a bearish head and shoulder pattern, July 31, 2014, on a poor earning's report. The company missed both sales and earning's estimate and guided lower. Since then, the stock has attempted to rally back to the fifty day moving average and head and shoulder neckline two times, but both attempts were in low volume.

Accelerating margins over the last four quarters are about the only thing good going for the coming, but revenue misses have led to decelerating earnings growth. Ruining the potential of accelerating margins. The company has missed analysts estimates for two straight quarters and estimates have been coming down significantly ever since. Three year sales growth is expected to decelerate from 35% to 1% and earnings growth is expected to stay steady at around 16%, but decelerate over at least another quarter to 9% from 83% three quarters ago.

The stock can be shorted as it breaks below the recent range between $66.00 and $66.25 with a tight stop just above recent highs around $67.30.

Full Disclosure: Hold Position


Tuesday, September 16, 2014

Financial Services Stock Susceptible to Further Downside on Fed Announcement - Altisource Portfolio Solutions (ASPS)

Altisource Portfolio Solutions (ASPS) broke out of a cup and handle base the week of October 28, 2011 and advanced 550% to its peak the week of December 6, 2013. The company benefited tremendously from lower rates and quantitative easing. Now that the easy money era is coming to a close, institutions have been busy selling off the stock.

Despite continued strong quarterly/annual sales and earnings growth, significantly beating analyst's estimates for three straight quarters, and higher analyst revisions, the stock was down over 50% from its peak after breaking down below it bearish head and shoulder neckline the week of August 8, 2014, but rallied back in below average volume to test its fifty day moving average and bearish head and should neckline along with the market the last few weeks. Keep in mind, historically, big winners like Altisource Portfolio Solutions (ASPS), tend to sell off well ahead of any major signs of growth problems become obvious to the general public and even the majority of analysts.

The stock can be shorted as it stalls at these levels and breaks below the neckline at around $97.44 in heavy volume, with protective stops initially just above $106. Conservative short sellers should wait to see how the stock reacts to tomorrow's Fed announcement before attempting a short position. Initial expected downside target would be $80 just below the fifty week low, and potentially as low $60 - 67, the next major support area.

Full Disclosure: No Current Position


Friday, September 12, 2014

Oil/Gas Exploration/Production Company Poised For Further Downside - Gulfport Energy (GPOR)

Gulfport Energy (GPOR), an oil and gas exploration and production company, advanced over 5,000% from its 2009 Financial Crisis low of $1.50, and almost 500% from its 2012 low of $15.79. The stock peaked on April 4th, 2014 at $75.75 and sold off off 32% to its August 1st, 2014 low of $51.59. It has spent the past six weeks pulling back to the fifty day moving average on diminishing, below average volume. A similar consolidation to the July 2014 roll over at the fifty day moving average that saw the stock fall just over 20% as it broke through the neckline of its bearish head shoulders consolidation in increasing volume.

The company is expected to grow sales and earnings by around 60% over the next three years, but has significantly missed analyst's estimates for three straight quarters by 72%, 5%, and 53%, respectively. Analysts have continuously lowered their estimates over the last ninety days, throwing doubt on those expected growth rates. Operating margins and return on equity have fallen for six straight quarters.

The stock can be shorted over the next few days as it continues to stall at the fifty day moving average around $57.56, or as it breaks the $55.50 - 56.00 range. Protective stops should be placed just above $59 initially. Our downside target is in the range of $46 - 50 (13 - 20%).

Full Disclore: No Current Position


Wednesday, September 10, 2014

3D Printer Maker on Verge of Breakdown - 3D Systems (DDD)

3D Systems (DDD), one of the bull market's biggest winners, advanced over 2,700% after breaking out of a first stage cup and handle base the week of December 4th, 2009. The stock topped at $97.28 the week of January 3rd, 2014 and has been in the process of forming a head and shoulder top. The stock had a false breakdown below the neckline the week of April 11th, 2014, and has spent the past nine months testing the neckline as the market has rallied higher. Each attempt over the neckline and fifty day moving average has come in below average volume (weeks May 30th, 2014, September 5th, 2014, and currently) or stalled (week of July 4th, 2014).

The company missed analysts earnings and sales estimates for the recent quarter and guided lower. Margins have contracted for six straight quarters from 11.2% to 6.1% and return on equity has fallen below 10%.

Traders could attempt to start shorting the stock as it starts stalling around the fifty day moving average around $52.94 and breaks back down below the moving average. Protective stops should be placed just above the thirty day high, currently $54.24, or whatever high the recent multi-day rally establishes. Downside target range is between $36 - 40 (24 - 35% approximately), which also coincides the average big winners fall after topping.


Friday, September 05, 2014

Yahoo's (YHOO) Bearish Head and Shoulder's Base Ahead of Ali Baba (BABA) IPO

Yahoo (YHOO), originally featured in Short Trading Idea: Yahoo (YHOO) Reminiscent of 3COM (COMS), continues to form the right shoulder of a bearish head and shoulder pattern ahead of Ali Baba's (BABA) IPO. Currently expected sometime early this month. The consolidation could be viewed as a bullish cup and handle base, but the pattern is a later stage base, wider and looser then any other consolidation in its entire run, and each rally attempt over the fifty day moving average has either stalled or been in below average trade. Increasing the likelihood of a rollover.

Fundamentally, outside of the cash the company will receive from the Ali Baba (BABA) IPO, already priced in, sales and earning's growth are projected to be negative over the next three years. Even with the new cash pile from the IPO, the company has failed to prove that any of its recent acquisitions will contribute to the companies top and bottom line growth in any significant way. Margins have been shrinking and returns on equity is a poultry 10%...very low in comparison to the stronger internet companies.

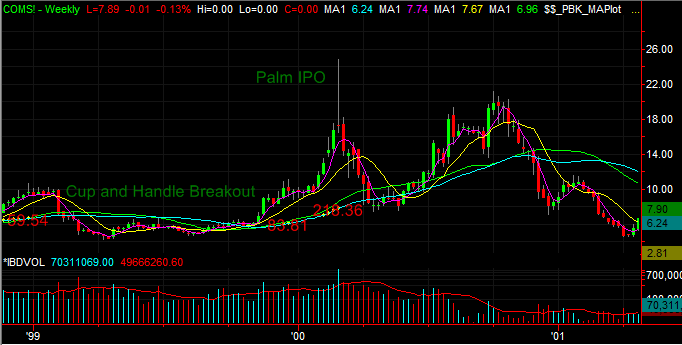
Yahoo (YHOO) has lost its 1990's glory of being the internet king to the likes of Google (GOOG), Facebook (FB), Twitter (TWTR), and even Microsoft (MSFT). Without any real growth, Yahoo (YHOO) will rollover from these levels and ultimately retrace most, if not all, of the stocks 254% advance over the last two years on the Ali Baba (BABA) hype. Aggressive traders could begin shorting the stock up at these levels with conservative investors waiting for the day of the Ali Baba (BABA) IPO opens for trading. Protective stops should be placed near recent highs around $39.60. The biggest risk to shorts is the uncertain timing of the Ali Baba (BABA) IPO. But like 3COM's (COMS) last hurrah before the Palm (PALM) spin off, Yahoo's (YHOO) days are numbered.


Wednesday, September 03, 2014

Lululemon Athletica (LULU) Poised For Further Downside

Lululemon Athletica (LULU), once a Wall Street darling and high flier, advanced over 3,800% from it 2009 lows, but has traded down over 55% since peaking at 82.50 in June of 2013. Margins have decelerated for five straight quarters, and sales and earnings growth which averaged over 30% consistently, are now expected to barely average 10% growth over the next three years. The company has beaten significantly downward revised estimates in each of the past four quarters, but analyst continue to revise future estimates lower despite those beats.

The stock is fairly valued at these levels if the company can slow down the deceleration of growth. If not, the stock could trade down to the mid 20's on another poor earning's report. A breakdown below the fifty day moving average around $39.50 - 40.00, in heavy volume, could signal another wave down for the stock. Protective stops should be placed around $42. Keep in mind, the stock is already down significantly and is susceptible to a major squeeze on news of better margins or a pick up in sales or earning growth.

Full Disclosure: No Current Position


Tuesday, July 22, 2014

Two Stocks Poised to Implode on Earnings This Week

Gilead Sciences (GILD) is reporting earnings Wednesday, July 23rd, after hours. The company has beaten earnings expectations over the last three quarters and analysts have revised the current quarters earnings estimates over 50% higher in the last ninety days. Margins are at multi-year highs and earnings are expected to grow 79% and sales 35% over the next three years.

Despite the market rally and beating earnings estimates the last two quarters by 10% and 62% respectively, the stock has failed to make much progress since the beginning of the year. It recently broke out of a late stage, v-shaped cup and handle base in below average volume. Since the breakout, the stock has been trading wildly with several above average distribution days, but has managed to hold the twenty day moving average.

The stock is up over 400% in two years and expectations are extremely high. Considering the late stage, v-shaped base, poor price volume action since the breakout, and lofty expectations, an earnings report that fails to amaze the street, will be met with major selling and potentially see the stock trade down below the two hundred day moving average.


Amazon (AMZN) is reporting earnings on Thursday, July 24th, after hours. The company has missed earnings estimates significantly in two out of the last four quarters and analysts have revised their expectations downwards. They now expect the company to report a loss of .15, down from an expected gain 90 days ago, and sales growth of 23%. Long term, the company is expected to grow earnings and sales, 125% and 21% over the next three years.

While the market has been making new fifty two week and all time highs, the stock has been forming a cup shaped base for the better part of this year. Volume is picking up as the stock climbs the right side of the cup, a positive sign, but the majority of the pattern has been formed below the two hundred day moving average, a major negative.

Expectations have been ratcheted down so much over the last few months, that a beat on the top and bottom line, with margin improvement, could launch the stock over $400. But, a miss, especially on the top line and margins, would send investors for the exits and the stock could be down over 10+% in after hours.


Tuesday, July 15, 2014

Short Trading Idea: Yahoo (YHOO) Reminiscent of 3COM (COMS)

Yahoo (YHOO), once the search engine leader and internet king, has fallen behind the likes of Google (GOOG), Facebook (FB), Twitter (TWTR), and many more in the new era of Internet 2.0. A new CEO and rumors of an eventual Ali Baba (BABA) IPO, of which Yahoo owns 24%, helped the stock advance just over 250% after breaking out of a cup and handle base the week of October 26, 2012 to its high on January 8, 2014.

The hype surrounding Marissa Mayer's ability to turn the company around has not come to fruition as of yet, if it ever does. Earnings have grown approximately 17% and sales have been negative during the advance. Analyst don't expect much out of the company over the next three years either. Earnings are expected to slow down to 8% and sales will show no growth at all. Not exactly growth type performance that warrants a stock trading at almost thirty times earnings, crediting most of the move more to Ali Baba's IPO then anything the company has actually done.

3COM (COMS) was in a similar situation when it announced the spin off of Palm (PALM), the hottest handheld device before Apple's (AAPL) Ipod and Iphone, in 2000. The company, once the king of modems, ran up over 2,300% from 1992 to 1996, but languished for the remainder of the bull market until announcing the Palm spin off. The stock then ran up up just over 350% in under five months until it topped on the Palm IPO, eventually being taken over by Hewlett Packard (HP) in 2009 well off its all time highs.


Yahoo is now in the process of forming a head and shoulder top with earning expected today after the closing bell. If the company does not start to show signs of turning sales and earning's growth around soon, the Ali Baba boost will not last long past the IPO. Based on current projections, the stock could fall back to near pre-breakout levels around $15 over the next 12 - 18 months and even lower if the market enters a sever bear market over the next few years.


Monday, July 07, 2014

Short Trading Idea: Pharmacyclics Inc. (PCYC) - Late Stage Base Failure

Pharmacyclics (PCYC) has been one of the bull markets biggest winners. Rising over 6,000% after breaking out of a flat base, inside of a cup and handle base, the week of September 11, 2009 above a $2.41 pivot point. At the breakout, the fundamentals were non existent. It was just a story. There was no sales or earnings growth, company was losing money, and estimates showed no signs of strong expectations and more losses.

Today, the fundamentals are fantastic. Sales and earnings are expected to grow 67% and 34% respectively, over the next three years. The problem is, even at lofty valuations, three times growth, the stock is fairly valued at these levels 12 - 18 months out. But a single hiccup, especially after poor recent guidance and estimates for this year and next few quarters extremely poor, could panic institutions into heavy selling.

The stock topped out the week of February 21, 2014 after gapping and breaking out of a late stage, double bottom with a high handle base on a strong earning's report, at just over $154. The relative strength line never confirmed the new high. The breakout failed over the next two weeks, eventually falling 46.7% and slicing through the fifty and two hundred day moving averages in heavier volume.

The stock has spent the last three month trying to breakout above the fifty day moving with little success while the market has rallied, and is currently in the process of stalling at the fifty day moving average for the third time. A breakdown below the fifty day moving average, in heavier volume, could cut the stock in half down into the $50 - 60 range. This would be within range of how far, on average, big winners fall after topping. Protective stops should be placed above $105 or the recent high just before the stock breaks down.

Click To Read Past Trading Ideas

Full Disclosure: No Current Position


Wednesday, July 02, 2014

Short Trading Idea: CME Group (CME)

CME Group (CME) has been forming a head and shoulder top for the last year while the market has been rallying higher. The stock sliced through the neckline in heavy volume back in April and has been digesting that sell off ever since. It has  attempted to rally back above the fifty day moving average three times with no success. The first two attempts were in below average volume and recently the stock has been stalling in heavier volume...no price progress. A decisive break, in heavier volume, below the fifty day moving average, could see the stock fall to new fifty two week lows and next support levels in the low to mid $60's. Protective stops should be placed around $72 to protect from major losses.

Full Disclosure: Hold Position


Tuesday, February 04, 2014

Market Higher But Volume Lags Leading Growth Stocks Consolidating

The market opened higher but quickly turned lower, only to find its footing and rally higher for the rest of the day. Volume lagged again, throwing suspicion to the quality of the attempt. Every recent rally attempt on lagging volume has been followed by high volume selling the following day.


While the market attempted to rally, Short Ideas stocks continued  lower and tightened up for further downside.

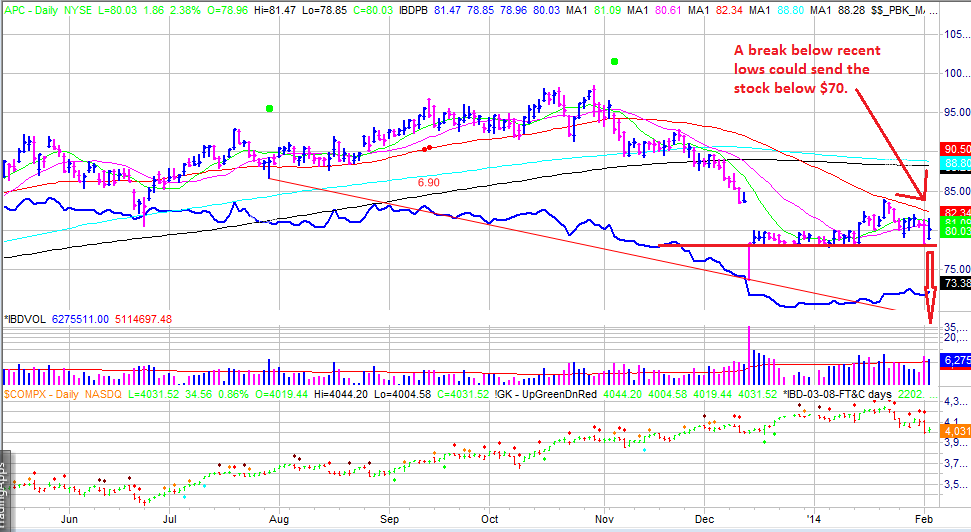
Anadarko Petroleum (APC) barely budged after reporting earnings this morning, rallying on lighter volume towards the ten and twenty day moving averages after rolling off the fifty day moving average two weeks ago. A break down below the recent low of 78.15 could send the stock into the low $70's or below.


Rackspace Holdings (RAX) is also consolidating into its fifty day moving average ahead of its earning's report on February 10th. A poor earning's report could send the stock gapping down to the low $30's. The stock has been forming a head and shoulder pattern since 2012.


Newfield Exploration (NFX) has been rolling off its fifty day moving average for the last two weeks and looks ready to test its head and shoulder pattern neckline around $22.50. Short the stock below the recent low of 24.96.


Select Comfort (SCSS) gapped down on earnings January 6th and has slowly digested those losses around the ten day moving average and is slowly rolling over for another big move lower towards the trend line around $14. Look for a break below 16.10.


J.C. Penney (JCP) continued its meltdown to all time lows. The stock gapped up at the open on positive same store sales, but quickly turned significantly lower on heavy volume and closed at the lows of the day and all time lows. Day traders can take advantage of the stocks habit of trending during the day.


Leading Growth Stocks recovered some of the losses from the previous session, but many need more time to finish proper consolidations while others are preparing to breakout or have broken out.

Michael Kors (KORS) broke out of a flat base pullback to the fifty day moving average on heavy volume after reporting a strong earning's report before the open. The stock should be watched for a new entry point over the next few days as the stock drifts down to sideways on lower volume.


Methode Electronics (MEI) has more then tripled since its first breakout, at the beginning of 2013, out of a cup and handle base, is now forming a flat base pullback to the fifty day moving average ahead of its earning's report February 27th. A move above the trend line around $35 could set the stock for a breakout move to $45.


The market continues to indicate more downside. But, as has been the pattern all year, leading growth stocks are starting to setup new consolidations to break out of over the next few weeks. New short trades should not be held for more then a few days, if not shorter. The market is still over extended to the downside and can become even more over extended, setting up a potential snap back rally over the next week or two.