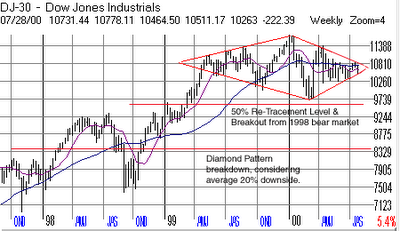
If you're a diamond lover, this article might change your mind. Diamond formations on a chart, particularly an index, are extremely rare. But when they do form they often signal a major bear market on the average of 20% from the breakdown point. The only good thing, the formation has a high failure rate of about 25%.
The DOW has formed a huge one year diamond pattern. The closing price, 10,511, on Friday was right at the breakdown point, and the index was running close to the end of the apex. A breakdown from here would surely send the index tumbling. Its first support level would be around the March low of 9,600, which is also its 50% re-tracement level, measured from its 1998 low to its 2000 high divided by two. This would almost put the index in bear market territory, which the NASDAQ has already seen.
A breakdown below the 50% re-tracement level, would surely put the index firmly into bear market territory, as the bears try and take the index down to the diamond formations average breakdown of 20%, or approximately 8,400 (measured by taking the breakdown level of approximately 10,511 x .80). The index could find support at around 8,775, but it would be weak support.
Tread lightly, as the NASDAQ has come under some selling pressure itself lately. A bounce is likely in the cards for this week as the indexes have experienced some heavy selling over the last week. Any bounce will postpone the diamond breakdown, but watch the volume for clues. If the rally comes on lower volume, and then reverses on a pick in volume, don't stick around to see what happens. Take your profits and run, or short if you can handle it.
Good Luck!!
If you have to remember anything, remember the following:
Cut you losses short. Let your winners run, not your losers.
No comments:
Post a Comment