It's been a while since I wrote this letter but things have been alittle busy.
Anyone who has been around me since beginning ofJanuary knows that I turned bearish and have been since then. Therally that went on in February was led by energy and basic materialstocks. These sectors do not lead market rallies for too long, theyjust don't have the long term growth rates necessary. If you paidattention to the price volume action of theindexes you would've noticed that the down days kept coming in inhigher volume then the up days. The NASDAQ which was the lastindex to show a follow through, followed through too late, andcouldn't mke any headway passed it's 50DMA. Leading stocks, whatleading stocks. That's right, right now there are none. Energy andbasic material stocks cannot lead a rally for too long, they justdon't have the long term growth rates necessary.
If you're not out of your long positions by now, make sure you keep areal close eye on them. If they are down significantly don't beafraid to take profit or the loss. Once the market gets some legsagain, there will be plenty of opportunities.
Wednesday, March 16, 2005

Monday, December 20, 2004
Market Letter
Jesse Livermore used to say that the market's job is to confuse asmany people as possible. That is exactly what the market has beendoing for the last few weeks. As expected, the market paused rightaround its highs from January of this year. Right now the battlebetween the bulls and the bears is keeping the market from makingany progress in either direction. We've had 3 nasty sell offs inthe last two weeks, which has raised a caution flag for me as far ashow much strength the market has right now to move higher. But acloser look at the leading stocks, and you'll quickly see, that theyhaven't budged. Most are calmly biding their time while the marketworks through its current congestion. The S&P which has beenleading since August has also continued to make new multi year highseven as the NASDAQ and DOW move sideways. Right now is a good timeto look through your stocks and weed out the laggards from yourportfolio to rebuild your ammo stockpile (cash or margin) so you'reready to buy new breakouts in your better performing stocks or newemerging leaders. It will also protect you if the market has runout of steam. As always, if we get a couple more of these nastysell offs in the next week or so, the current bull could be introuble and don't be afraid to go to cash until the market can getits footing.
The rest of this week and month should see a decrease in tradingactivity as Wall Street prepares for Christmas and New Years.There's not much as far as earnings until the second week ofJanuary, when earnings season will begin.
A reader asked about NAVR, and immediately tried to justify why itshould be bought right now because of fundamentals. Pastfundamental performance is meaningless if the stock is headinglower. The market only cares what the fundamentals will look like6 - 8 months from now. Estimates might look good, but the smartmoney knows better then to look at estimates available to thegeneral public. They have their own team of analyst doing theresearch, and that's the research you'll never see. All I see is astock with good fundamentals but poor technicals. The stock triedto breakout of a late stage consolidation (base), and quicklyfailed. The failure could be due to the market having difficultygoing higher. But, the stock sliced though it's 50 DMA on heavyvolume, and hasn't been able to recover back above it. At thispoint, I would at least take some profits off the table, and keep atight watch over the next few days and weeks on the stocks technicalaction. If you're not in it, then wait for it to setup again, rightnow the risk/reward isn't in your favor considering the technicalaction of the stock and market.
You might be thinking that the estimates and data available is useless. By themselves I would say yes. Combined with technicals,it allows you to get a clearer picture of what the smart moneyknows. Are the technicals always right? No. But our job is tominimize our risk, and maximize our gain. We will miss some of thebig runs, but we will also avoid some of the big sell offs, savingus allot of money in the end. Remember, 100% gain, can be wiped outby 50% loss. So it's easier to lose your money, than make it.
If you want a good example of how using only fundamentals would'vefailed big time, just look back to 2000 when the bubble burst.Every stock that was absolutely getting creamed, fundamentallylooked like they were going to be the next CSCO or MSFT. But, justlike clockwork, 6 - 8 months later most of those companies startedto report problems with their fundamental picture going forward.
The rest of this week and month should see a decrease in tradingactivity as Wall Street prepares for Christmas and New Years.There's not much as far as earnings until the second week ofJanuary, when earnings season will begin.
A reader asked about NAVR, and immediately tried to justify why itshould be bought right now because of fundamentals. Pastfundamental performance is meaningless if the stock is headinglower. The market only cares what the fundamentals will look like6 - 8 months from now. Estimates might look good, but the smartmoney knows better then to look at estimates available to thegeneral public. They have their own team of analyst doing theresearch, and that's the research you'll never see. All I see is astock with good fundamentals but poor technicals. The stock triedto breakout of a late stage consolidation (base), and quicklyfailed. The failure could be due to the market having difficultygoing higher. But, the stock sliced though it's 50 DMA on heavyvolume, and hasn't been able to recover back above it. At thispoint, I would at least take some profits off the table, and keep atight watch over the next few days and weeks on the stocks technicalaction. If you're not in it, then wait for it to setup again, rightnow the risk/reward isn't in your favor considering the technicalaction of the stock and market.
You might be thinking that the estimates and data available is useless. By themselves I would say yes. Combined with technicals,it allows you to get a clearer picture of what the smart moneyknows. Are the technicals always right? No. But our job is tominimize our risk, and maximize our gain. We will miss some of thebig runs, but we will also avoid some of the big sell offs, savingus allot of money in the end. Remember, 100% gain, can be wiped outby 50% loss. So it's easier to lose your money, than make it.
If you want a good example of how using only fundamentals would'vefailed big time, just look back to 2000 when the bubble burst.Every stock that was absolutely getting creamed, fundamentallylooked like they were going to be the next CSCO or MSFT. But, justlike clockwork, 6 - 8 months later most of those companies startedto report problems with their fundamental picture going forward.
Saturday, December 04, 2004
Market Letter
So much for the pause, the market blasted ahead this week onpowerful volume. Economic news was mostly good, except for thepayroll job numbers. The economy added jobs just not at the pacethe economists expected. Without the job news, the market could'vebeen up allot more, after Intel guided their earnings higher. Theguidance shouldn't have been a surprise, since the semi-sector wasalready strong, indicating better news ahead for the entire sector.Earlier in the week, a rapid drop in oil prices got the market in abuying mood. The market may pause again this week, as it approachesthe January highs.
A reader asked me about SIRI and AMX. SIRI is an interesting stock,but a highly speculative one. If you owned it before the suddenmove up, great, but to buy it now would be exposing yourself to toomuch risk. AMX is a great stock. It has it all, fundamentals andtechnicals, but the best time to have bought the stock was back inOctober. The stock will move with the market. It's ok to buy thestock here since it has paused, but I would be out quick if themarket starts to sell off hard or the stock gives you sell signals.Otherwise, it should be a good one as long the market is still inbull mode, may have power to $70 or above.
A reader asked me about SIRI and AMX. SIRI is an interesting stock,but a highly speculative one. If you owned it before the suddenmove up, great, but to buy it now would be exposing yourself to toomuch risk. AMX is a great stock. It has it all, fundamentals andtechnicals, but the best time to have bought the stock was back inOctober. The stock will move with the market. It's ok to buy thestock here since it has paused, but I would be out quick if themarket starts to sell off hard or the stock gives you sell signals.Otherwise, it should be a good one as long the market is still inbull mode, may have power to $70 or above.
Monday, November 29, 2004
Market Letter
The market has paused since the 17th. Can we say dollar? Yes, thedollars depreciation has almost taken over for oil as a potentialmarket drag. But all bull markets like to climb a wall of worry, sothis is the new worry of the day. Don't worry; oil is still in theback of most people's mind.
All bull markets pause to consolidate and shake off the froth. Thisweek brings alot of big economic reports. GDP, oil inventories, andpayroll numbers. Any of these numbers can jolt the market one wayor another. If you've noticed the action in the market, you've seenthe market gap up and come in almost regularly on these reports,similar action to the bull run of last year. This type of actiontends to suppress the speculation in the market, and allow it tomove in a steady fashion. But, speculation can't be held backforever, and once it is unleashed, that final run is usually a signof a top to come. My point is, in a gap up opening, be careful ininitiating long positions that day, as they might quickly reverse onyou. Best times to buy, is a flat opening, or a down opening and areversal into positive territory.
Keep looking for breakouts as leading stocks continue to consolidatewell, as the market takes a breather. If my assumptions arecorrect, the market should continue to move higher through the firstquarter of next year. But keep an eye on it, conditions can changein as little as one week.
All bull markets pause to consolidate and shake off the froth. Thisweek brings alot of big economic reports. GDP, oil inventories, andpayroll numbers. Any of these numbers can jolt the market one wayor another. If you've noticed the action in the market, you've seenthe market gap up and come in almost regularly on these reports,similar action to the bull run of last year. This type of actiontends to suppress the speculation in the market, and allow it tomove in a steady fashion. But, speculation can't be held backforever, and once it is unleashed, that final run is usually a signof a top to come. My point is, in a gap up opening, be careful ininitiating long positions that day, as they might quickly reverse onyou. Best times to buy, is a flat opening, or a down opening and areversal into positive territory.
Keep looking for breakouts as leading stocks continue to consolidatewell, as the market takes a breather. If my assumptions arecorrect, the market should continue to move higher through the firstquarter of next year. But keep an eye on it, conditions can changein as little as one week.
Wednesday, November 24, 2004
Market Update
Market continues to act well. We are in for abreather at some point, and Friday may have started it. But by the way the market reversed today it looks like it just wants to continue higher. I'm not one to argue with the market as long you have strict risk and profit management rules in place. Several mergers and big dividends are about to close and get distributed. This will add alot of liquidity to drive the markethigher. On top of the economy reaccelarating, andchristmas just around the corner, it looks like itwill be a merry christmas and a happy new year for themarkets. Leading stocks, continue to lead. Even asthe market has had some bouts with distribution days,they have held up nicely, and have corrected modestly.Earlier this year, the exact opposite occured,leading stocks came crashing back into bases as themarket got sold off. Hold onto your winners as longas they are not showing sign of weakness, and look fornew buys that maybe setting up for the next leg up.Oil could still pose a short term problem, but as soonas it stabilizes the market just discounts it andmoves higher. The rally that started in late Augustis still intact. We got rally confirmation days onall the indexes, even though the DOW needed to do ittwice since it undercut it's August rally low, on theSpitzer affect. Volume has been running much heavier on up daysthan down days. Look back at MArch 2003 and you will see alot ofsimilarities between the two markets. Earlier this year, everyrally was followed by heavy selling in the indexes. The advancedecline has also been trending higher since August. The 20 and 50DMA have crossed overon both the NASDAQ and S&P, and we're just waiting onthe DOW. The S&P has been the leader so far thisyear, but that may change as the NASDAQ ramps up. Nomatter which index leads, just look for the leadingstocks. If you haven't particiapted up to now, there are stillopportunities out there, you just need to look for them.
Wednesday, November 01, 2000
October Market Update
The market took us on another roller coaster ride during the month of October. The market started down in the beginning of the month on the typical concern that we will have another crash, such as the one's in 1929, 1987, & 1998. Adding to the downdraft was Intel's earnings report. Intel reported earnings that were two cents lower than expectations, caused by lower average selling prices of its chips. Dell warned that its quarter would miss as a result of higher DRAM prices, due to the Taiwan earthquake, making Wall Street wonder about the true extent of the earthquake. IBM stated that its 4th quarter wouldn't meet expectations due to Y2K spending slowdown, which brought the Y2K issue back to the forefront of concern. The Producer Price Index (the "PPI") came in at 1.1%, sending the market spiraling down, rejuvenating concern that inflation is bearing its ugly head, and sending the 30-year bond close to the 6.4% level.
The market did an about face around the middle of the month when the Consumer Price index (the "CPI") failed to confirm the inflation picture that the PPI portrayed. It became evident that the PPI's spike was caused mainly by the increase in oil and cigarette prices. Intel, after dropping the earnings bomb on the market early on, had an upbeat meeting with analysts, introducing the new family of chips, stating that their 4th quarter will be strong, and that they don't see any Y2K slowdowns in their business. To top it off, the final economic indicators, the GDP, came in at a strong 4.8%, and the two inflationary indicators, GDP chain deflator and employment cost index, came in below expectations, confirming that the economy continues to experience good growth with low inflation. The good economic news sent the long bond yield down to 6.2%, adding the third component that the stock market likes, lower interest rates.
The month ahead will be a challenging one. Y2K is still a major issue on the minds of investors, and any hint that it may cause disruptions could cause another market downturn. The Employment Payroll Report, which shows job growth and increases in hourly wages, will be an important one on the 5th of November. The PPI on the 10th and the CPI on the 17th will be closely watched, especially after the 1.1% spike by the PPI in October. The Federal Reserve Committee meeting on the 16th is the all-important date. We will find out the Fed's plans for interest rates going forward. The consensus seems to be that the Fed will raise rates by 25 basis points. And of course some more earnings, but they'll be secondary drivers.
The market did an about face around the middle of the month when the Consumer Price index (the "CPI") failed to confirm the inflation picture that the PPI portrayed. It became evident that the PPI's spike was caused mainly by the increase in oil and cigarette prices. Intel, after dropping the earnings bomb on the market early on, had an upbeat meeting with analysts, introducing the new family of chips, stating that their 4th quarter will be strong, and that they don't see any Y2K slowdowns in their business. To top it off, the final economic indicators, the GDP, came in at a strong 4.8%, and the two inflationary indicators, GDP chain deflator and employment cost index, came in below expectations, confirming that the economy continues to experience good growth with low inflation. The good economic news sent the long bond yield down to 6.2%, adding the third component that the stock market likes, lower interest rates.
The month ahead will be a challenging one. Y2K is still a major issue on the minds of investors, and any hint that it may cause disruptions could cause another market downturn. The Employment Payroll Report, which shows job growth and increases in hourly wages, will be an important one on the 5th of November. The PPI on the 10th and the CPI on the 17th will be closely watched, especially after the 1.1% spike by the PPI in October. The Federal Reserve Committee meeting on the 16th is the all-important date. We will find out the Fed's plans for interest rates going forward. The consensus seems to be that the Fed will raise rates by 25 basis points. And of course some more earnings, but they'll be secondary drivers.
Monday, August 07, 2000
Markets - What a Wedgie
If you're getting excited about the action of the last few days, I have some potentially bad news. This is the same exact action we saw in the markets in the middle of the March/April Sell off.
All three major indexes, DOW, NASDAQ, & S&P have been wedging higher. That is, rising while volume has been drying up. What does this mean to you? Even though the markets have been rising, the conviction of institutions to fully commit has been lacking. Without them, the current rally doesn't stand a chance.
All three major indexes, DOW, NASDAQ, & S&P have been wedging higher. That is, rising while volume has been drying up. What does this mean to you? Even though the markets have been rising, the conviction of institutions to fully commit has been lacking. Without them, the current rally doesn't stand a chance.
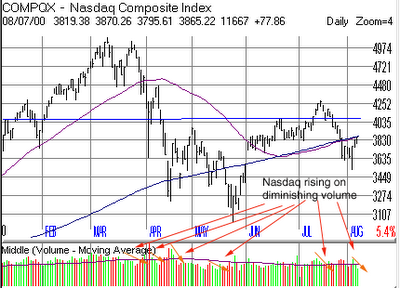 Also interesting, the short ratio topped out almost at the same time the market started to rally in early June. Enforcing the idea that the current rally was nothing more then a short squeeze. The bull/bear and put/call ratios also never saw the extremes that these ratio exhibits when firm bottoms are made, and the DOW and NASDAQ are below their 200 day moving averages.
Right now is a good time to be cautious. There are a lot of contrarian indicators pointing to further declines in the markets, but look for upcoming economic numbers to potentially add fuel to this rally. The market should rally strong if the economic numbers are good. If they don't, then put the red flag up, and start waving it.
The market has now entered it's worst three months of the year. If the past is any indication, then don't look for this current rally to materialize into anything more then a bear trap.
I have one prediction. If this rally is a bear trap and the market does sell off, look for a bottom to be put in late August or early September. Why? Everyone is on to the fact that the market has bottomed in October for the past few years. I believe that these people will sell off their holdings earlier in anticipation of the bottom, and position themselves back in stocks earlier to try and take full advantage of the bottom.
Good Luck!!
If you have to remember anything, remember the following:
Cut you losses short. Let your winners run, not your losers.
Sunday, August 06, 2000
Kulicke & Soffa - KLIC
Here is a great example of why all the research in the world wouldn't have clued you in to the earnings warning to come from KLIC on 8/3. But looking at the chart, you would've realized that something fishy was going on.
Looking at the weekly chart below, the stock broke out of a year long cup and handle pattern, and went on to move 124% over the next three months before topping out with the rest of the market in March.

 The stock was also part of the strong semiconductor equipment group, which almost every analyst on the street was touting the strong fundamentals, and how the cycle of growth would continue into at least next year. But what do they know?
If you were lucky enough to ride the stock out of the cup and handle, good, but if you didn't get out, you're sitting on a nice loss, bad!!
So how would you have know to get out? Volume wasn't much of a factor in this chart. If you look at the move up or even down early on there wasn't much distribution. The two big days of distribution days on 3/16 and 4/4 were more like accumulation days, as the stock recovered from major sell offs those day to close in the upper range of the day.
Confused yet? Well, good, then your learning that you need to add other sell indicators to your arsenal. In this case the drop below the 50 day moving average on 3/14 should've gotten you out of the stock. If you were stubborn and didn't get out you probably swallowed your heart over the next few days as the stock fell all the way down to 20, the breakout level of the cup and handle pattern, before reversing higher. At that point you were thanking god that the stock began to move higher. The stock proceeded to power through it's 50 day moving average on higher volume. So you thought you were out of the woods, and were able to pick up those cocktail party discussions. Ha!!! Boy were you wrong. The stock continued higher for a few more days but on absolutely no conviction, and then crashed through the 50 day moving average on heavy volume. If you didn't get out here then you were asking for trouble, as the stock tested the $20 level again. At this point a descending triangle began to form. If you at least recognized this bearish pattern forming, you still could've gotten as the stock tested the upper range of the triangle and the 50 day moving average several more times, and failed to break throughor hold above. OK, if you're still in the stock, then the break through the 200 day moving average on 7/21 should've been a final warning that you should take your profit and run.
At this point emotion begins to take over. Traders start to question their selling ability. The most common thought, it's down so far, it can't possibly go lower considering it's in a strong sector. Well, if you were paying attention to the SOX index, you would've realized that the sector the stock was in was on the verge of breaking down itself (Read the 7/31 Stock of The Week, where MB. featured this potential breakdown).
So what's the conclusion? Somebody obviously knew something we didn't know. This was a well orchestrated distribution, as volume didn't clue us in. But the constant breakdown below the 50 day moving average, was a good sign that the institutions were up to no good. This level and the 200 day, are usually where the institutions like to do their buying and selling. So the warning on August 3rd shouldn't have been to much of a surprise. You had plenty of opportunities to get out, hopefully you took them. If not, learn from this experience and don't make the same mistake again.
Good Luck!!
Looking at the weekly chart below, the stock broke out of a year long cup and handle pattern, and went on to move 124% over the next three months before topping out with the rest of the market in March.

 The stock was also part of the strong semiconductor equipment group, which almost every analyst on the street was touting the strong fundamentals, and how the cycle of growth would continue into at least next year. But what do they know?
If you were lucky enough to ride the stock out of the cup and handle, good, but if you didn't get out, you're sitting on a nice loss, bad!!
So how would you have know to get out? Volume wasn't much of a factor in this chart. If you look at the move up or even down early on there wasn't much distribution. The two big days of distribution days on 3/16 and 4/4 were more like accumulation days, as the stock recovered from major sell offs those day to close in the upper range of the day.
Confused yet? Well, good, then your learning that you need to add other sell indicators to your arsenal. In this case the drop below the 50 day moving average on 3/14 should've gotten you out of the stock. If you were stubborn and didn't get out you probably swallowed your heart over the next few days as the stock fell all the way down to 20, the breakout level of the cup and handle pattern, before reversing higher. At that point you were thanking god that the stock began to move higher. The stock proceeded to power through it's 50 day moving average on higher volume. So you thought you were out of the woods, and were able to pick up those cocktail party discussions. Ha!!! Boy were you wrong. The stock continued higher for a few more days but on absolutely no conviction, and then crashed through the 50 day moving average on heavy volume. If you didn't get out here then you were asking for trouble, as the stock tested the $20 level again. At this point a descending triangle began to form. If you at least recognized this bearish pattern forming, you still could've gotten as the stock tested the upper range of the triangle and the 50 day moving average several more times, and failed to break throughor hold above. OK, if you're still in the stock, then the break through the 200 day moving average on 7/21 should've been a final warning that you should take your profit and run.
At this point emotion begins to take over. Traders start to question their selling ability. The most common thought, it's down so far, it can't possibly go lower considering it's in a strong sector. Well, if you were paying attention to the SOX index, you would've realized that the sector the stock was in was on the verge of breaking down itself (Read the 7/31 Stock of The Week, where MB. featured this potential breakdown).
So what's the conclusion? Somebody obviously knew something we didn't know. This was a well orchestrated distribution, as volume didn't clue us in. But the constant breakdown below the 50 day moving average, was a good sign that the institutions were up to no good. This level and the 200 day, are usually where the institutions like to do their buying and selling. So the warning on August 3rd shouldn't have been to much of a surprise. You had plenty of opportunities to get out, hopefully you took them. If not, learn from this experience and don't make the same mistake again.
Good Luck!!
Monday, July 31, 2000
Noven Pharmaceuticals - NOVN
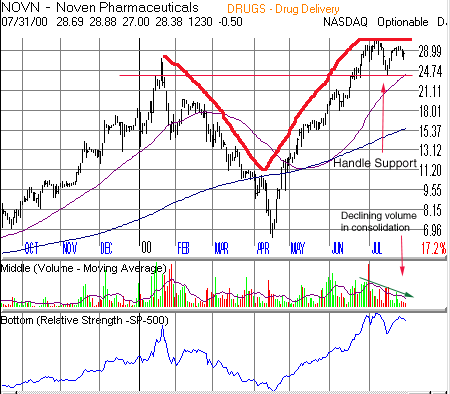
Here's a stock worth keeping an eye on. The stock is in the final stages of forming a cup with handle pattern. It has been forming a downward wedging handle for four weeks on declining volume. Exactly the type of price and volume action you'd like to see at the end of a cup and handle formation. This type of action shakes out the week holders.
The price inside the handle needs to hold above support at around 23.75 or the whole pattern could be rendered a failure, and may present a shorting opportunity under the support level.
Fundamentally the stock is starting to hit its stride. The company is expected to grow 100% this year, and 65% next year. Its five year projected growth rate is 40%. Analyst have been raising their estimates quite consistantly for the next two quarters and years.
Look for the stock to break the high of its handle at 31.875 before initiating a position. If the stock breaks out on heavy volume and continues higher, it could double rather quickly. But of course, either your stop loss, or the action in the price and volume will guide your sell decision.
Remember: 7% stop losses from your buy point on all trades, or whatever you're comfortable with. Preserve your capital, and you will live to fight another day. Lose it, and back to mutual funds you go.
Sunday, July 30, 2000
Techne Corp. - TECH
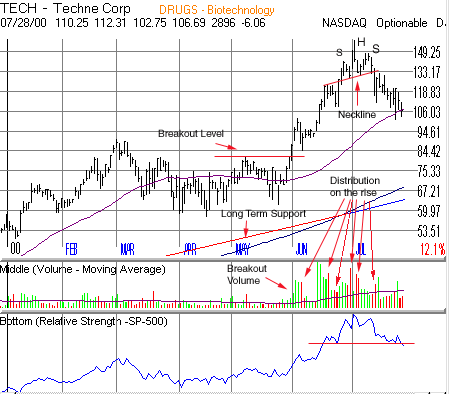
Techne Corp. was one of the first stocks to breakout in the most recent rally. If you were lucky enough to get in on the breakout, and get out near the top, you saw your investment appreciate approximately 95% in less then a month.
The stock broke out of a 12+ week base on heavy volume. The handle of the base which lasted about 3+ weeks was a bit sloppy, but the sloppiness came on low volume. If you missed the initial breakout because of the sloppiness, and the sharp move from the bottom of the base through the breakout area, you got a second chance to enter the stock as it paused for about 7 days, and consolidated in a triangle formation. The stock broke out of the triangle on extremely heavy volume and proceeded to around 120, where it paused again to consolidate its move before making its final advance. Up to this point the stock had experienced three distribution days. The first one wasn't concerning as it came right after a big breakout. The second one, again, wasn't to concerning as it too came after a big move. But this one should've raised a cautionary flag, as the volume was extremely heavy. The third distribution day came two days after the second, on above average volume, but nowhere near as heavy as the first two. The stock then proceeded to breakout of that consolidation and head higher on what would be its final run, and the formation of a head and shoulder top. A fourth day of distribution came quite quickly, and on the heaviest volume since the run began, forming the left shoulder. The yellow flag should be up and waving at this point. The run the next day to new high's on just average volume should have put up the red flag. The following day the stock ran up on the open 12 points, only to reverse course and close down 5+ points on extremely heavy volume, forming the head, and logging the fifth day of distribution. This should've been the your final warning, and put up the checkered flag, as this signaled that the stock had run its course, and this was the time to get out, or at least to move up your stop loss to the previous consolidation.
If you were still in the stock at this point, you got another chance to get out with a handsome profit. The stock tried to rally, but the rally came on decreasing volume. Some tried to argue that the volume was above average. But a closer examination would've revealed that it didn't compare to the volume during the rest of the move or the last two distribution days. The sixth day of distribution was then logged, forming the right shoulder and breaking down through the neckline. You could've gotten out at this point, and still would've held on to your profits even if you would have bought the stock as late as the third consolidation in the 120's.
Remember, 4 to 5 distribution days is enough to topple a stock or an index.
Even though the stock has experienced two days recently that look like solid accumulation, big volume spikes on price surges, the stocks relative strength line has broken down. If you read the article on the SOX index, then you know that a breakdown of the relative strength line, is usually a good precursor to what's to come for a stock or index.
If you're still holding the stock, you may be asking for trouble. Those that bought on the first two breakouts still have a profit, everyone else is now sitting on a loss.
Good Luck!!
PMC Sierra - PMCS
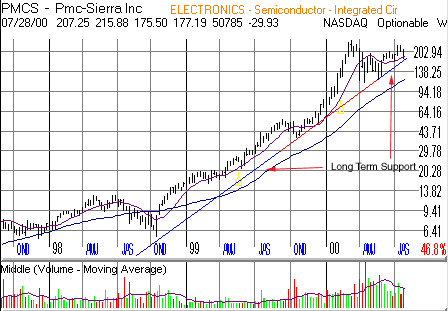
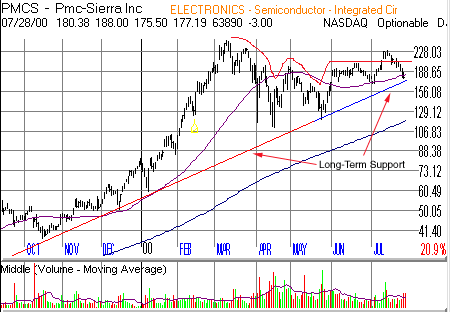 This stock has been one of the stocks recently that has broken out on heavy volume, only to breakdown almost immediately.
The stock had formed a double bottom formation with a handle. The volume during the double bottom formation had acted well. The volume was heavy on the first sell off, then was heavy, but not as heavy as the first sell off, on the second sell off, and the volume in the handle dried up, before the stock broke out on heavy volume.
As is usually common, volatile stocks such as PMCS typically follow the path of the market, and began selling off about two weeks ago, rendering the breakout a failure. But there is short term hope on the horizon.
The stock, as well as the market, are extremely oversold at this point and are due for a technical bounce, also know as a 'dead cat bounce'. The stock is also approaching a critical support line that has dated back to the end of 1998. It has bounced off this support several times, and looks as if it is about to find support there again. One clue I find interesting is that the stock only sold off moderately on Friday as the NASDAQ had its biggest point loss in some time, meaning the selling pressure is moderating.
It would be risky to try and buy the stock before testing the support level, as a dead cat bounce is not guaranteed. Look to enter the stock at around 172, but watch the market on whether or not to reconsider the buy decision. If the market isn't reversing to go higher, avoid the stock, until the market reverses direction to the upside.
If you do enter the trade on the long side, don't overstay your welcome with greed. The stock may try and bounce to the $200 level. Volume will be crucial. If it is declining during the recovery, then your sell signal will be the day the stock undercuts the prior days low. This would be a good point for the high risk trader to initiate a short position.
Remember: 7% stop losses from your buy point on all trades, or whatever you're comfortable with. Preserve your capital, and you will live to fight another day. Lose it, and back to mutual funds you go.
Diamonds - Here's One Your Girlfriend Won't Want
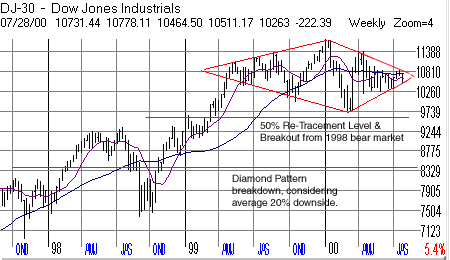
If you're a diamond lover, this article might change your mind. Diamond formations on a chart, particularly an index, are extremely rare. But when they do form they often signal a major bear market on the average of 20% from the breakdown point. The only good thing, the formation has a high failure rate of about 25%.
The DOW has formed a huge one year diamond pattern. The closing price, 10,511, on Friday was right at the breakdown point, and the index was running close to the end of the apex. A breakdown from here would surely send the index tumbling. Its first support level would be around the March low of 9,600, which is also its 50% re-tracement level, measured from its 1998 low to its 2000 high divided by two. This would almost put the index in bear market territory, which the NASDAQ has already seen.
A breakdown below the 50% re-tracement level, would surely put the index firmly into bear market territory, as the bears try and take the index down to the diamond formations average breakdown of 20%, or approximately 8,400 (measured by taking the breakdown level of approximately 10,511 x .80). The index could find support at around 8,775, but it would be weak support.
Tread lightly, as the NASDAQ has come under some selling pressure itself lately. A bounce is likely in the cards for this week as the indexes have experienced some heavy selling over the last week. Any bounce will postpone the diamond breakdown, but watch the volume for clues. If the rally comes on lower volume, and then reverses on a pick in volume, don't stick around to see what happens. Take your profits and run, or short if you can handle it.
Good Luck!!
If you have to remember anything, remember the following:
Cut you losses short. Let your winners run, not your losers.
Thursday, July 27, 2000
Broadcom - BRCM
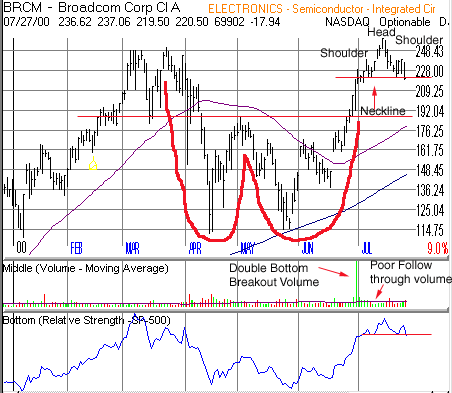
This stock is a day traders dream. Once it gets going one way or another, there is some serious profits to be made. Unfortunately for BRCM shareholders, the current direction looks down.
The stock broke out of a double bottom formation in late June on heavy volume. But that first day was the only good thing about the breakout. The stock proceeded higher on below average volume, which indicated a lack of interest on the part of the institutions to accumulate the stock.
The stock has now formed a potential head and shoulder top. It is currently sitting right at the neckline. Its relative strength line is on the verge of breaking down. A break below the neckline, under 220, could take the stock under 200, to the breakout level of the double bottom around 188.
The stock is closely related to the SOX index, so if the breakdown in the index is any indication, the stock should follow suit. One important warning, don't overstay your welcome if the market turns up. The reason I say the market, is that even if the stock is weak, a strong market will most likely pull this bad boy higher, and fast. A small profit could turn into a big loss in a blink of an eye. This short is for investor who can watch the stock closely during the day. If you do short BRCM and get stopped out, don't be afraid to re-enter the short again. The market is most likely getting oversold and is due for at least a technical bounce over the next few trading days.
Remember: 7% stop losses from your buy point on all trades, or whatever you're comfortable with. Preserve your capital, and you will live to fight another day. Lose it, and back to mutual funds you go.
Wednesday, July 26, 2000
Advanced Micro Devices - AMD
If you haven't read it yet, then go back and read this weeks stock of the week column on the SOX index and AMAT, before reading today's daily setup. To summarize the article, Mike B. wrote that he thought that the index was on the verge of breaking down, and taking the stocks in it and related to it down with it. Guess what, the index broke down, and many of the related stocks are on the verge of collapse. AMD is one of those stocks.
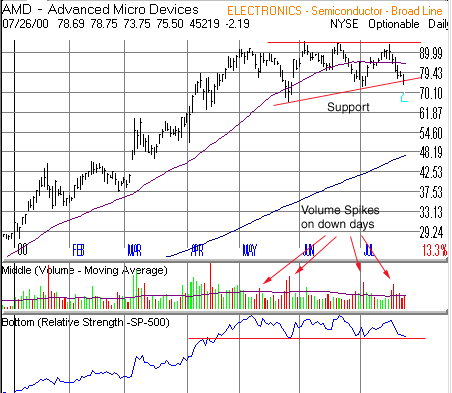
This stock was one of the only stocks that ran higher during the March/April sell off. At a first glance at the chart, the stock looks like it is forming an upward trending triangle, which is a bullish consolidation. It seems like the stock is trying to digest the big gains made from its run since the end of last October. But if you look at the volume action throughout the consolidation that started back in May, the picture gets outright bearish.
Over the 12+ weeks the stock has been consolidating, it has logged 20 distribution days compared to 6 accumulation days, 5 of which came on pretty lame volume. The other one, on 6/5, the stock tried to breakout on higher volume, could be considered a distribution day as the stock ran up on high volume and closed in the bottom of that days range. Notice also the large amount of spikes in volume on down days. The last six days alone have logged 3 distribution days.
Intel the leader in AMD's category has come under heavy distribution lately too. The report on slowing PC sales, doesn't help the stock either, as its micro processor division makes or breaks the company. The breakdown in the SOX is a further negative and could be the final straw that breaks this camels back.
Anyone who reads Investors Business Daily should've taken notice that even as the stock was approaching its highs, the accumulation/distribution rating, which measures institutional buying or selling interest, was a D, signaling that institutions were unloading their shares. This rating and the volume spikes on down days gave you two of the best clues that the stock was resting only to go lower. It looks like the institutions were unloading the shares while the news was good, and amateur investors were scooping it up not to miss the next leg up. It looks like their not going to enjoy the next leg down as it kicks them in the balls. Maybe the big boys know something we don't. Hmmmmm? Only time will tell.
This stock look like a short under 76.5. The stock is just on the edge of breaking down below its 2 month up-sloping trend line. It actually broke the trend line today on heavy volume, but managed to close just on the border. Look for a continuation move down tomorrow, and enter if you can handle the potential volatility. Conservative short players may want to wait for the stock to take out its July low of 72 1/2, as this level could act as initial support from the trend line breakdown. The next support level is 66, the May low, after that the stock could fall to 61, and finally the 200 day moving average at around 48. Follow the SOX index for clues as to when and where the stock may find a bottom.
Just to let you know, I shorted the stock today at 76 1/2.
Remember: 7% stop losses from your buy point on all trades, or whatever you're comfortable with. Preserve your capital, and you will live to fight another day. Lose it, and back to mutual funds you go.
Tuesday, July 25, 2000
Hewlett Packard - HPQ
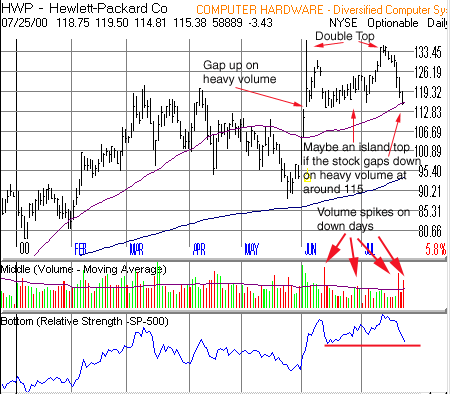 Mother Russia is going to be proud of me. Tonight's daily setup, HWP, another one of America's darlings, has set up as a short.
Fundamentally the stock has gotten some bad news from outside itself. The stock sold off on heavy volume on Friday when Agilent warned of a shortfall in earnings for the quarter, and adding to the pressure was the report yesterday showing that PC sales are slowing down.
Technically this chart is just sickening. Ever since the stock peaked on 6/5 it has logged 7 distribution days. 4 of those distribution days came on volume spikes. The last attempt at its high came on waning volume, signaling that the stock maybe tired, and forming the second top in the double top formation. The stock is a short under 115 1/2, which was broken today on heavy volume. The stock also closed below its 50 day moving average, and is pretty close to making a lower low on its relative strength line (it actually made a lower low on the weekly chart below) further enhancing the bearish scenario. An island top will be created, if, over the next several days the stock were to gap down in this area on heavy volume to go along with its gap up on heavy volume on 6/5.
Looking at a longer term chart (see below), there are two major support lines. The stock has been trending higher since the stock bottomed at the end of October last year. During the last sell off, the stock found support, and bounced higher off of this trend line, which corresponded with the stocks breakout out of a cup and handle pattern earlier this year (man those long term charts can be helpful).
Conservative short players may want to cover off the trend line support currently at around 106, unless the stock slices through there on heavy volume. The next stop if that happens is 92 1/2, the area of the cup and handle breakout, and currently around the 200 day moving average. If you do cover at 106, and the stock bounces higher watch the volume. If the bounce comes on low volume then keep your eye on the stock as a possible re-entry short if it breaks the trend line. Also keep in mind that the 200 day moving average is trending higher, and could act as support before the stock reaches 92 1/2.
One more thing. The stock is due to report earnings in early August, so this breakdown in the stock could be a preview of a possibly poor report. But, if the stock starts to show accumulation over the next few days, don't over stay your welcome on the short side.
Just to let you know, I shorted the stock today at 115 1/2.

Remember: 7% stop losses from your buy point on all trades, or whatever you're comfortable with. Preserve your capital, and you will live to fight another day. Lose it, and back to mutual funds you go.
Monday, July 24, 2000
Microsoft - MSFT
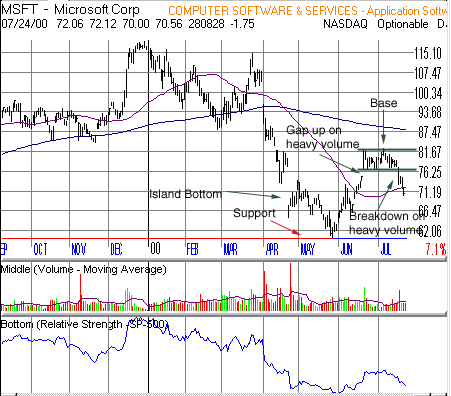
This is going to be my communist pick of the year. Short Microsoft. Did I say that? Yes, short Mr. Softee!!! Why? It stinks, the chart is a mess, the fundamentals are a mess, and all this points to no where but down.
I wasn't this bearish on the stock a few days ago. In fact I was looking to go long, but how things change over the course of just a few days. The stock had put in an Island bottom, followed by a gap up on heavy volume into a flat base to consolidate its move from the low 60's, and looked like it was getting ready to attack the high 80's. But all that came crashing to a halt when the stock sold off and broke down out of its base on heavy volume after reporting earnings on 7/19. The stock has now formed an intermediate island top. The sell off today through the 50 day moving average and the declining relative strength make the stock an even better short and most likely will force MSFT to test its support level in the low 60's. I would be a short seller of the stock under 71.
The companies fundamentals aren't looking good either. For a stock that is supposed to be dominating the world, 13% revenue growth is quite paltry. Earnings? What a joke those are. The company has used realized gains from sale of investments to make them look good. So what you say? Your not buying the company because they are in the business of making investments for you. You buy them for their operations in software, which doesn't seem to be growing so fast anymore. Think about it this way, if the market were to crash, devaluing their investments, or MSFT sold out of all their investments, they would have nothing left to hide the poor performance of their software business. Realized gains are one time events. Once they are gone, they are gone unless you can keep making good investments. If that is what MSFT has become, then let them tell us that, and we'll value them as if they were a mutual fund, or an incubator, rather then a software company. Think about it another way. If the use of realized gains to make earnings look good was ok, then why weren't analyst pounding the buy recommendations on 7/19? Why weren't the mutual funds scooping it up at these bargain basement levels? The chart says it all, they want out. Don't believe the guest on CNBC when he says he loves MSFT at these levels. What is he supposed to say? I hate the stock I own 10,000,000 shares of and I want you to sell it so I can get killed. I don't think so.
The Justice Department is another thorn in their side. As long as the anti-trust case goes on, it will distract the company from doing what they have to do to stay as the top software company. There is no way they will be permitted to bundle any other critical piece of software with their operating system or make an acquisition that may strengthen them. Joel Klein will see that doesn't happen.
If you're skeptical about initiating a short right now, wait and see what happens. If the market turns northward, the stock may attempt to rally to the bottom of the base it broke down from at around 76. Watch the volume. If the stock does rally, but on light volume, then initiate the short on the day it stops moving higher and reverses.
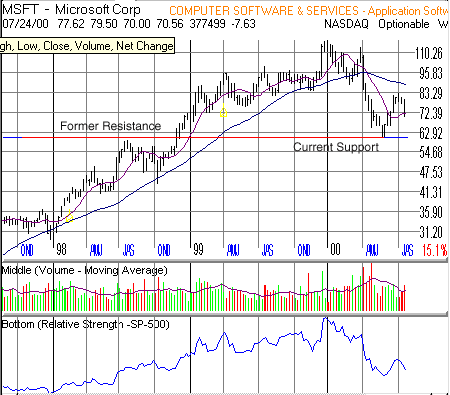
Here is a chart lesson for some of you. Notice on the chart below how the low 60's, the exact spot the stock found support at during its prior sell off, happens to be a resistance level the stock ran into back in 1998. It is always important to look back in time to see if you can identify spots where the stock will find some buying support, this will help you identify the potential fall after the stock has broken down. For long term investors, it could identify a spot to initiate a new position. For short seller it identifies a spot they may want to cover at. For traders it identifies a spot where the stock can bounce for a few point gain.
What if the stock breaks the support in the low 60's? Well if it comes on heavy volume, their is a minor support at around 55, the middle of a double bottom the stock formed in 1998, and a major support at 47, the bottom of the double bottom formed in 1998. Long term investors, good luck. Hey, you never know, I might just join you if the chart changes. That's the beauty of technical analysis, love them one day, hate them the next. And it's not always in days, in can be in minutes.
Just to let you know, I shorted the stock today at 71.
 Remember: 7% stop losses from your buy point on all trades, or whatever you're comfortable with. Preserve your capital, and you will live to fight another day. Lose it, and back to mutual funds you go.
Sunday, July 23, 2000
Cisco Systems - CSCO
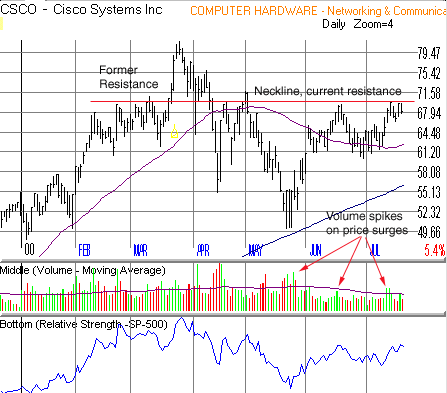
I got to say, CSCO is looking good here. It is in the process, actually at the end of forming a head and shoulders bottom pattern. Notice the spikes in volume on price surges, signaling accumalation. The bullish bottoming formation and the accumulation signals make CSCO a potential buy if it can break 69 7/8, the neckline of the head and shoulder pattern, on heavy volume, at least 50% greater then the 50 day moving average. Also, notice how the neckline acted a resistance back in February and March. This indicates there was/were a big player(s) that wanted out at these levels. Now the question remains, is/are those player(s) done selling here. If it does breakout, that'll be your signal that they're done for now and the stock should challenge its all time high of 82, at which time it would have completed the cup of a potential cup and handle pattern. At that point the stock should pause and form a handle that consolidate its gains, and wedges lower for a few weeks to shake out the remaining weak holders.
Of course CSCO moves with the market, and if the market fails to advance it will take CSCO down with it. If this happens I can see CSCO testing its low of 50, as it proceeds to form a double bottom pattern. So don't overstay your welcome on the long side if the market starts to look weak over several days.
If you're a long-term investor looking to initiate a position, I would like the stock to head down and test its long term trend line, dating back to its IPO, at approximately $42/share. But remember, this line is sloping upward, so everyday that passes, the area I would like CSCO to test is rising. If the market were to tumble over the next few weeks, this line may move into the high 40's to low 50's strengthening the support for the stock in that area. Long term investors may want to watch this area as a place to initiate a position. A prolonged breakdown below this level, could signal that good days for CSCO are over.
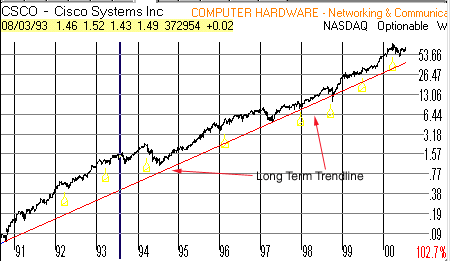
In conclusion, I'm looking to go long right now at above 69 7/8, but, if the market turns I will look to short. In either case I have a plan, now it's time to execute.
Remember: 7% stop losses from your buy point on all trades, or whatever you're comfortable with. Preserve your capital, and you will live to fight another day. Lose it, and back to mutual funds you go.
Friday, July 21, 2000
Semiconductor Index - SOX & Applied Materials - AMAT
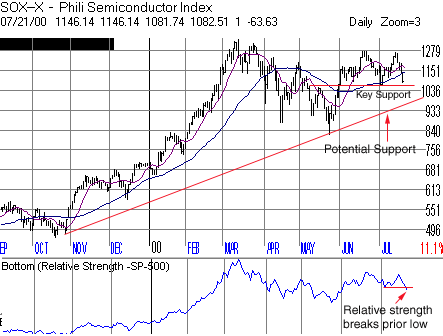
One of the leading index's over the past year has been the Semiconductor Index, a.k.a "The SOX". This index over the past several weeks has become more volatile as several leading stocks in the index have broken down from their bases.
One indicator that traders look at heavily is the industries book to bill ratio, which indicates the amount of orders coming in compared to the amount of merchandise being shipped out. A ratio above one is positive as it indicates that the companies are getting in more orders then they are shipping out. In the June quarter the book-to-bill ratio was 1.26, which is down from the previous month of 1.46. Although the indicator is over 1.00 it is starting to decelerate. This indicator has to be watched very closely, as it is usually a predicator of what to expect from these companies as far as earning and sales are concerned going out several months.
Another thing that is very disturbing is that the indexes relative strength made a lower low. The relative strength gauges the strength of the index compared to the S&P 500. It's breakdown is usually a precursor to future down moves in the index. This will be confirmed if the index breaks its key support level of 1065.64. Also watch the leading stocks in the index such as; AMAT, NVLS, TQNT, and others.
Let's take a look at the chart of AMAT, one of the leading stocks in the index. First, let me note that the stock has broken its uptrend and it seems to be in the process of rolling over. Second, the relative strength has already broken one low, and is on its way to breaking its lowest low that was set back in April. If this is broken in the next week or two, it will confirm the downtrend and the possibility of continued lower prices.
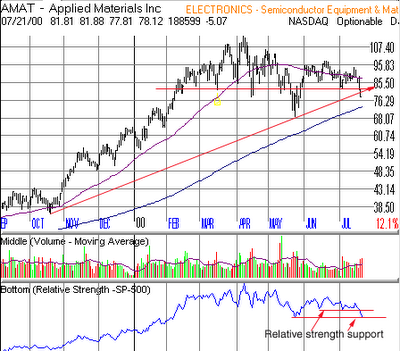
In additon, earnings and sales are great for this company and the industry. Expectations are running high, so any disappointment or lack of phenominal surprise, will be disastrous for the stocks in this index.
One final note, the weakest part of the year is coming, August - October. Investors should be very cautious on what they buy, monitoring the markets and their stocks carefully, and honor thy stops religiously!!!
Thursday, July 20, 2000
FTI Consulting - FCN
 If you were looking for a micro-cap stock that has the potential to run, then FCN is the company to do it.
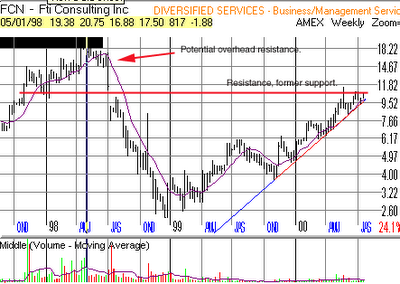
 The stock has been trending higher since November 1999 with pauses in between. The stock is currently in a 9 week cup and handle pattern. Volume has steadily dried up since the stock peaked on May 22nd, indicating that there aren't many sellers. During the course of the nine week consolidation there have been three price surges on above average volume, indicating heavy accumulation.
The stocks pivot point, breakout point, is 10 7/8. Look for a breakout on above average volume. If it can clear this pivot point, it should head higher to 14, where it may encounter resistance from some overhead supply left there after its early 1998 collapse. It will be healthy to see the stock pause at that level, and shakeout out the remaining weak holders, if any are left, and then attack and take out the old high at 19 3/8. Notice on the chart below, how the current resistance level coincides almost exactly with a former support level. It's always a good idea to look back at a long term chart to see if anything could be standing in your way.
But be careful with this one. The daily volume is thin, so the volatility could shake you out quite quickly. If it does, so be it, but don't let it piggy back you down with it if it turns down.
Remember: 7% stop losses from your buy point on all trades, or whatever you're comfortable with. Preserve your capital, and you will live to fight another day. Lose it, and back to mutual funds you go.
Wednesday, July 19, 2000
Siebel Systems - SEBL

Here is a stock for those looking to enter an aggressive short position. Siebel Systems had formed a 14 week cup with a handle pattern, and broke out on 7/7 on average volume, which was the first sign that the stock was doomed to fail. Typically you'd like to see the stock break out on volume that is at least 50% higher then its 50 day moving average. The next two days it proceeded to pullback into the handle base on below average volume. On 7/12 the stock broke out again, but this time on below average volume. It continued higher for the next two days with no sign of volume pick up, which translated into a lack of conviction by the institutions to accumulate the stock. The second sign the stock was going to fail. Without the buying power of the institutions, stocks typically will not have enough power to move higher by themselves. On 7/17 the stock reversed course and started heading lower. The volume started to pick up as the stock headed lower, and today as the stock came back into the handle base, the stock fell 7 7/8 on volume that was 50% greater then the 50 day moving average. It looks like the stock wants to form a longer handle which will shakeout the rest of the weak holders, setting up for a future possible breakout.
The stock is a good short anywhere just under 170 1/2, which is the breakout point. The stock should head lower to approximately 147, which is it's 50 day moving average and bottom of the handle. If the stock breaks through this point on heavy volume, the bottom is anyone's guess, but I would say it would be around 120.
Keep your stop loss at 7% of your purchase price or right above the breakout point of 170 1/2 (for more conservative traders). This stock is volatile and may try to breakout again. If it does, be prepared to enter on the long side. If the volume is not above average look for the stock to pull back into the base, and become a short candidate once again. This stock tends to follow the market, so make sure you take that into consideration when deciding where to cover the short.
Remember: 7% stop losses from your buy point on all trades, or whatever you're comfortable with. Preserve your capital, and you will live to fight another day. Lose it, and back to mutual funds you go.
Subscribe to:
Posts (Atom)