It is important to analyze the market on a daily basis. In order tobe a successful trader, you have to be able to decipher real movesfrom head fakes, and adjust your trading accordingly.
I've been quite bullish on this market since 4/29, and got even morebullish last week when the terrorist attacks and $60/barrell oilfailed to hold the market down for long. But something fishy isgoing on. The rally seems more of a short covering rally the lastfew days, then real accumulation. Stocks that should be movingstrong with the market, just don't seem to be making any headway.
Now I always disclaim my statements with, "I could be wrong", that'swhy it's also important to backup that statement with a plan ofaction. So here is ours:
1. Continue to unload the laggards.
2. Keep a close eye on the strong performers for any sign ofweakness or sell signals.
3. Never let a good profit turn into a loss even if you can onlyretain $1.
4. Make sure the love of your life (your favorite stock or the oneyou truly believe is the one that will make you rich) can be partedwith on a moments notice. BOOM was a good example of that for ustoday. We had an awesome gain, added as he bounced off his movingaverage on volume, added some more as he broke to 52 weeks highs onvolume today, but out of no where the stock reversed hard on massivevolume today almost wiping all the gains we had. We didn'thesitate, sold the whole position to at least lock what was left ofthe profit. If we had held on, we would be underwater by severalthousand dollars. But we swore, he was the one. Today could'vebeen just one massive shakeout on him, but rules are rules, and ourrelationship with BOOM is over for now.
5. Tighten up the criteria for stocks that will be purchased if themarket continues to head higher.
6. Any sign of weakness on new buys quick profits or losses shouldbe taken. The 7 - 8% rule applies only to strong bull markets. Inflaky markets gains and losses need to be taken/cut quicker, andless trading needs to be done.
7. Start looking for potential short candidates in former leadingstocks that topped several months ago if we do go into a correction.
Now I'm not calling for a panic out the door. Just a reduction inexposure and tighter rules for increasing exposure. My belief atthis point is that the market has one more massive shakeout in store(another attack, a sudden climactic run of oil to $70+, you get mypoint) for us before any rally can materialize and have some stayingpower longer then a few months. This rally, if you've been playingit smart has yielded some nice returns, I just don't want to seethem evaporate and turn into losses. If the rally continues, great,we still have a large exposure to leading stocks, but I'd rather besafe then sorry.
Tuesday, July 12, 2005

Thursday, July 07, 2005
Market Letter
Could fear run anymore rampant this morning? We got the perfectshakeout today to force the weak shareholders to sell. Deamnd isabout to outstrip supply in the market, causing prices to rise. Nowthe employment report could change all that but how much worse canthenews get? Oil over $60, rates still rising, London Terrorist Attack,and anything else you read about. The market signaled today that thejobs report tomorrow will come in to their liking no matter what thatis. The market likes to climb a wall of worry. Uncertainty it hates.
If I'm correct in my assumptions, I suggest you're ready with yourbuylist if the job data is to the markets liking.
If I'm correct in my assumptions, I suggest you're ready with yourbuylist if the job data is to the markets liking.
Friday, June 24, 2005
Market Letter
Market has been moving sideways to higher in the last few weeks andsold off hard today on higher volume as oil crossed $60/barrel. Italmost seems like December where the market churned higher, and thenjust got crushed in January.
Hold onto the stronger stocks as one distribution day won't kill themarket, but definitely getting rid of the laggards. This is a goodtime to start looking for new setups. It seems we will need onemore down to sideways week to allow for proper bases to setup in thestronger stocks. Some are already setup just waiting for a signalfrom the market.
Oil reached $60 a barrel, but it almost seems that a double top hasnow formed. If these levels are sustained the market will needsometime to digest which would mean that a summer correction in themarkets is 90% likely, unless oil retreats away from $60/barrel.What will the market be looking for? How will oil in the $60'seffect the economy. $50's didn't hurt. But will the $60's?
Even if we do start a correction here, we'll probably see anotherweek or two rally somewhere during earnings season. If this is thecase and the rally is weak, then even the strongest of stocks needto be examined even closer, and possibly sold. For now, just getrid of the laggards.
Only time will tell, for now better get safe then sorry.
Hold onto the stronger stocks as one distribution day won't kill themarket, but definitely getting rid of the laggards. This is a goodtime to start looking for new setups. It seems we will need onemore down to sideways week to allow for proper bases to setup in thestronger stocks. Some are already setup just waiting for a signalfrom the market.
Oil reached $60 a barrel, but it almost seems that a double top hasnow formed. If these levels are sustained the market will needsometime to digest which would mean that a summer correction in themarkets is 90% likely, unless oil retreats away from $60/barrel.What will the market be looking for? How will oil in the $60'seffect the economy. $50's didn't hurt. But will the $60's?
Even if we do start a correction here, we'll probably see anotherweek or two rally somewhere during earnings season. If this is thecase and the rally is weak, then even the strongest of stocks needto be examined even closer, and possibly sold. For now, just getrid of the laggards.
Only time will tell, for now better get safe then sorry.
Wednesday, May 18, 2005
Market Letter
Officially all the major market indexes are now in confirmed rallies.Today we finally got another powerful day in the market confirmed byvolume. I know I was cautious the other day, but the first rule inthe market is to always protect your capital. At this point I'm evenmore convinced that my original call was correct that we have seen abottom and the market will continue to move higher. If you haven'tparticipated in this rally to this point, I would recommend you begin.By the time things become obvious that is usually the end of the move.
I found something very interesting while doing my research the lasttwo days. Retail and hotel/motel REITs, retailers, and other consumercompanies are either at or near 52 weeks highs. If the economy isdoing so poorly why are these stocks moving higher. Is it possiblethat the market is signaling better times ahead as it usually does?I'd say yes. As long as there is a Republican President the mediawill continue to try and convince you that the economy is heading intorecession. But the market knows better.
Don't let your opinions keep you on the sidelines. If this marketweakens for some reason, I'll let you know. For now, do your researchand get involved. But don't take my word for it, just look at theprice volume action of the market, especially the NASDAQ, which isleading index at this point.
Remember, always protect your capital first.
I found something very interesting while doing my research the lasttwo days. Retail and hotel/motel REITs, retailers, and other consumercompanies are either at or near 52 weeks highs. If the economy isdoing so poorly why are these stocks moving higher. Is it possiblethat the market is signaling better times ahead as it usually does?I'd say yes. As long as there is a Republican President the mediawill continue to try and convince you that the economy is heading intorecession. But the market knows better.
Don't let your opinions keep you on the sidelines. If this marketweakens for some reason, I'll let you know. For now, do your researchand get involved. But don't take my word for it, just look at theprice volume action of the market, especially the NASDAQ, which isleading index at this point.
Remember, always protect your capital first.
Tuesday, May 17, 2005
Market Letter
On the surface, today looked like a strong day, but digging deeperthe market continued its pattern of sell offs on high volume andrallies on low volume. Today was no different. The major averageshad huge gains but volume was no where to be found. At this point Iwould be reducing your exposure to the long side especially ifyou're on margin. It looks like the market may need another downleg before moving higher, particularly the DOW and S&P. If youremember I got extremely bullish when the NASDAQ undercut 1900 andrallied strongly, but I was cautious about the fact that I would'veliked to see the DOW undercut 10,000. It now looks like it mayhappen. If not, then I will resume increasing my exposure on thelong side. For now though, no need to take any chances with thecurrent price volume action of the major indexes. Tomorrow is thePPI report; let's see how the market acts.
I've heard a lot about buying homebuilders for the long term orinvesting in real estate in hot markets. If you're one those peopleI would strongly reconsider. The homebuilders are looking extremelyweak on their charts and look like they are topping. Talk to anyreal estate professional who's willing to give you a true assessmentof the market, and they will tell you that things aren't looking asgreat as things seem. Prices are getting away from most people'scomfort and affordability range. Most of the buying is being doneby investors and by homeowners who already own 2+ properties. Takeinto account that on every market news channel you have oneanalyst/real estate professional after another telling you this timeit's different and we are in a paradigm shift, and shivers shouldstart to creep down your neck. Think back to the stock market in1999 and 2000, they were saying the same thing about stocks. Therest eventually was history as we all know.
Learn from history, it repeats itself, more then you think.
I've heard a lot about buying homebuilders for the long term orinvesting in real estate in hot markets. If you're one those peopleI would strongly reconsider. The homebuilders are looking extremelyweak on their charts and look like they are topping. Talk to anyreal estate professional who's willing to give you a true assessmentof the market, and they will tell you that things aren't looking asgreat as things seem. Prices are getting away from most people'scomfort and affordability range. Most of the buying is being doneby investors and by homeowners who already own 2+ properties. Takeinto account that on every market news channel you have oneanalyst/real estate professional after another telling you this timeit's different and we are in a paradigm shift, and shivers shouldstart to creep down your neck. Think back to the stock market in1999 and 2000, they were saying the same thing about stocks. Therest eventually was history as we all know.
Learn from history, it repeats itself, more then you think.
Wednesday, May 04, 2005
Market Outlook
The market gave us a powerful confirmation day on all the indexes. Ifyou're not long yet or haven't looked for setups I suggest you start.If anything changes I will let you know.
Sunday, May 01, 2005
Market Letter
My belief is that the market marked a bottom on Friday. Barring anyunforeseen events, we should move higher from here. Here are someof the reasons:
1. Sentiment has been highly bearish over the last several weeks.
2. The NASDAQ under cut 1900 and traders began to panic.
3. Oil is under $50 a barrel and prob has topped, again barring anyunforeseen turmoil in the Middle East.
4. Top rated stocks with high growth have begun to breakout out ofbases and hold their breakout points. Other stocks are close tofinishing up their bases.
5.The reversal on Friday came on heavy volume.
6. Earnings are coming in well above expectations and guidance hasbeen good.
7. Softer economic data recently may be signaling that the Fed hasdone their job and interest rates maybe close to topping in the nextmonth or two.
The market may be seeing better times on the horizon. Remember,recent bad news is already built in and the market moves on futureexpectations ( 6 - 8 months outward). Typically, things look theworst at the bottom and the best at the top.
We may still go lower but not by much. I would have preferred theDOW to undercut 10K on Friday to really set off even more panic.
To get a firm confirmation that this rally will hold, we will need astrong up day sometime after Tuesday of next week on heavier volumethen the previous day and no more high volume sell off days.
This leg up won't be the best one, but it is a start. Once morestocks setup and breakout, the market will then have the ammo toreally make a move.
Nothing is 100%. Cut your losses short, and if the market starts toget distributed next week, get off margin as we may actually need tosee the DOW under 10K before we could go higher.
1. Sentiment has been highly bearish over the last several weeks.
2. The NASDAQ under cut 1900 and traders began to panic.
3. Oil is under $50 a barrel and prob has topped, again barring anyunforeseen turmoil in the Middle East.
4. Top rated stocks with high growth have begun to breakout out ofbases and hold their breakout points. Other stocks are close tofinishing up their bases.
5.The reversal on Friday came on heavy volume.
6. Earnings are coming in well above expectations and guidance hasbeen good.
7. Softer economic data recently may be signaling that the Fed hasdone their job and interest rates maybe close to topping in the nextmonth or two.
The market may be seeing better times on the horizon. Remember,recent bad news is already built in and the market moves on futureexpectations ( 6 - 8 months outward). Typically, things look theworst at the bottom and the best at the top.
We may still go lower but not by much. I would have preferred theDOW to undercut 10K on Friday to really set off even more panic.
To get a firm confirmation that this rally will hold, we will need astrong up day sometime after Tuesday of next week on heavier volumethen the previous day and no more high volume sell off days.
This leg up won't be the best one, but it is a start. Once morestocks setup and breakout, the market will then have the ammo toreally make a move.
Nothing is 100%. Cut your losses short, and if the market starts toget distributed next week, get off margin as we may actually need tosee the DOW under 10K before we could go higher.
Wednesday, March 16, 2005
Market Letter
It's been a while since I wrote this letter but things have been alittle busy.
Anyone who has been around me since beginning ofJanuary knows that I turned bearish and have been since then. Therally that went on in February was led by energy and basic materialstocks. These sectors do not lead market rallies for too long, theyjust don't have the long term growth rates necessary. If you paidattention to the price volume action of theindexes you would've noticed that the down days kept coming in inhigher volume then the up days. The NASDAQ which was the lastindex to show a follow through, followed through too late, andcouldn't mke any headway passed it's 50DMA. Leading stocks, whatleading stocks. That's right, right now there are none. Energy andbasic material stocks cannot lead a rally for too long, they justdon't have the long term growth rates necessary.
If you're not out of your long positions by now, make sure you keep areal close eye on them. If they are down significantly don't beafraid to take profit or the loss. Once the market gets some legsagain, there will be plenty of opportunities.
Anyone who has been around me since beginning ofJanuary knows that I turned bearish and have been since then. Therally that went on in February was led by energy and basic materialstocks. These sectors do not lead market rallies for too long, theyjust don't have the long term growth rates necessary. If you paidattention to the price volume action of theindexes you would've noticed that the down days kept coming in inhigher volume then the up days. The NASDAQ which was the lastindex to show a follow through, followed through too late, andcouldn't mke any headway passed it's 50DMA. Leading stocks, whatleading stocks. That's right, right now there are none. Energy andbasic material stocks cannot lead a rally for too long, they justdon't have the long term growth rates necessary.
If you're not out of your long positions by now, make sure you keep areal close eye on them. If they are down significantly don't beafraid to take profit or the loss. Once the market gets some legsagain, there will be plenty of opportunities.
Monday, December 20, 2004
Market Letter
Jesse Livermore used to say that the market's job is to confuse asmany people as possible. That is exactly what the market has beendoing for the last few weeks. As expected, the market paused rightaround its highs from January of this year. Right now the battlebetween the bulls and the bears is keeping the market from makingany progress in either direction. We've had 3 nasty sell offs inthe last two weeks, which has raised a caution flag for me as far ashow much strength the market has right now to move higher. But acloser look at the leading stocks, and you'll quickly see, that theyhaven't budged. Most are calmly biding their time while the marketworks through its current congestion. The S&P which has beenleading since August has also continued to make new multi year highseven as the NASDAQ and DOW move sideways. Right now is a good timeto look through your stocks and weed out the laggards from yourportfolio to rebuild your ammo stockpile (cash or margin) so you'reready to buy new breakouts in your better performing stocks or newemerging leaders. It will also protect you if the market has runout of steam. As always, if we get a couple more of these nastysell offs in the next week or so, the current bull could be introuble and don't be afraid to go to cash until the market can getits footing.
The rest of this week and month should see a decrease in tradingactivity as Wall Street prepares for Christmas and New Years.There's not much as far as earnings until the second week ofJanuary, when earnings season will begin.
A reader asked about NAVR, and immediately tried to justify why itshould be bought right now because of fundamentals. Pastfundamental performance is meaningless if the stock is headinglower. The market only cares what the fundamentals will look like6 - 8 months from now. Estimates might look good, but the smartmoney knows better then to look at estimates available to thegeneral public. They have their own team of analyst doing theresearch, and that's the research you'll never see. All I see is astock with good fundamentals but poor technicals. The stock triedto breakout of a late stage consolidation (base), and quicklyfailed. The failure could be due to the market having difficultygoing higher. But, the stock sliced though it's 50 DMA on heavyvolume, and hasn't been able to recover back above it. At thispoint, I would at least take some profits off the table, and keep atight watch over the next few days and weeks on the stocks technicalaction. If you're not in it, then wait for it to setup again, rightnow the risk/reward isn't in your favor considering the technicalaction of the stock and market.
You might be thinking that the estimates and data available is useless. By themselves I would say yes. Combined with technicals,it allows you to get a clearer picture of what the smart moneyknows. Are the technicals always right? No. But our job is tominimize our risk, and maximize our gain. We will miss some of thebig runs, but we will also avoid some of the big sell offs, savingus allot of money in the end. Remember, 100% gain, can be wiped outby 50% loss. So it's easier to lose your money, than make it.
If you want a good example of how using only fundamentals would'vefailed big time, just look back to 2000 when the bubble burst.Every stock that was absolutely getting creamed, fundamentallylooked like they were going to be the next CSCO or MSFT. But, justlike clockwork, 6 - 8 months later most of those companies startedto report problems with their fundamental picture going forward.
The rest of this week and month should see a decrease in tradingactivity as Wall Street prepares for Christmas and New Years.There's not much as far as earnings until the second week ofJanuary, when earnings season will begin.
A reader asked about NAVR, and immediately tried to justify why itshould be bought right now because of fundamentals. Pastfundamental performance is meaningless if the stock is headinglower. The market only cares what the fundamentals will look like6 - 8 months from now. Estimates might look good, but the smartmoney knows better then to look at estimates available to thegeneral public. They have their own team of analyst doing theresearch, and that's the research you'll never see. All I see is astock with good fundamentals but poor technicals. The stock triedto breakout of a late stage consolidation (base), and quicklyfailed. The failure could be due to the market having difficultygoing higher. But, the stock sliced though it's 50 DMA on heavyvolume, and hasn't been able to recover back above it. At thispoint, I would at least take some profits off the table, and keep atight watch over the next few days and weeks on the stocks technicalaction. If you're not in it, then wait for it to setup again, rightnow the risk/reward isn't in your favor considering the technicalaction of the stock and market.
You might be thinking that the estimates and data available is useless. By themselves I would say yes. Combined with technicals,it allows you to get a clearer picture of what the smart moneyknows. Are the technicals always right? No. But our job is tominimize our risk, and maximize our gain. We will miss some of thebig runs, but we will also avoid some of the big sell offs, savingus allot of money in the end. Remember, 100% gain, can be wiped outby 50% loss. So it's easier to lose your money, than make it.
If you want a good example of how using only fundamentals would'vefailed big time, just look back to 2000 when the bubble burst.Every stock that was absolutely getting creamed, fundamentallylooked like they were going to be the next CSCO or MSFT. But, justlike clockwork, 6 - 8 months later most of those companies startedto report problems with their fundamental picture going forward.
Saturday, December 04, 2004
Market Letter
So much for the pause, the market blasted ahead this week onpowerful volume. Economic news was mostly good, except for thepayroll job numbers. The economy added jobs just not at the pacethe economists expected. Without the job news, the market could'vebeen up allot more, after Intel guided their earnings higher. Theguidance shouldn't have been a surprise, since the semi-sector wasalready strong, indicating better news ahead for the entire sector.Earlier in the week, a rapid drop in oil prices got the market in abuying mood. The market may pause again this week, as it approachesthe January highs.
A reader asked me about SIRI and AMX. SIRI is an interesting stock,but a highly speculative one. If you owned it before the suddenmove up, great, but to buy it now would be exposing yourself to toomuch risk. AMX is a great stock. It has it all, fundamentals andtechnicals, but the best time to have bought the stock was back inOctober. The stock will move with the market. It's ok to buy thestock here since it has paused, but I would be out quick if themarket starts to sell off hard or the stock gives you sell signals.Otherwise, it should be a good one as long the market is still inbull mode, may have power to $70 or above.
A reader asked me about SIRI and AMX. SIRI is an interesting stock,but a highly speculative one. If you owned it before the suddenmove up, great, but to buy it now would be exposing yourself to toomuch risk. AMX is a great stock. It has it all, fundamentals andtechnicals, but the best time to have bought the stock was back inOctober. The stock will move with the market. It's ok to buy thestock here since it has paused, but I would be out quick if themarket starts to sell off hard or the stock gives you sell signals.Otherwise, it should be a good one as long the market is still inbull mode, may have power to $70 or above.
Monday, November 29, 2004
Market Letter
The market has paused since the 17th. Can we say dollar? Yes, thedollars depreciation has almost taken over for oil as a potentialmarket drag. But all bull markets like to climb a wall of worry, sothis is the new worry of the day. Don't worry; oil is still in theback of most people's mind.
All bull markets pause to consolidate and shake off the froth. Thisweek brings alot of big economic reports. GDP, oil inventories, andpayroll numbers. Any of these numbers can jolt the market one wayor another. If you've noticed the action in the market, you've seenthe market gap up and come in almost regularly on these reports,similar action to the bull run of last year. This type of actiontends to suppress the speculation in the market, and allow it tomove in a steady fashion. But, speculation can't be held backforever, and once it is unleashed, that final run is usually a signof a top to come. My point is, in a gap up opening, be careful ininitiating long positions that day, as they might quickly reverse onyou. Best times to buy, is a flat opening, or a down opening and areversal into positive territory.
Keep looking for breakouts as leading stocks continue to consolidatewell, as the market takes a breather. If my assumptions arecorrect, the market should continue to move higher through the firstquarter of next year. But keep an eye on it, conditions can changein as little as one week.
All bull markets pause to consolidate and shake off the froth. Thisweek brings alot of big economic reports. GDP, oil inventories, andpayroll numbers. Any of these numbers can jolt the market one wayor another. If you've noticed the action in the market, you've seenthe market gap up and come in almost regularly on these reports,similar action to the bull run of last year. This type of actiontends to suppress the speculation in the market, and allow it tomove in a steady fashion. But, speculation can't be held backforever, and once it is unleashed, that final run is usually a signof a top to come. My point is, in a gap up opening, be careful ininitiating long positions that day, as they might quickly reverse onyou. Best times to buy, is a flat opening, or a down opening and areversal into positive territory.
Keep looking for breakouts as leading stocks continue to consolidatewell, as the market takes a breather. If my assumptions arecorrect, the market should continue to move higher through the firstquarter of next year. But keep an eye on it, conditions can changein as little as one week.
Wednesday, November 24, 2004
Market Update
Market continues to act well. We are in for abreather at some point, and Friday may have started it. But by the way the market reversed today it looks like it just wants to continue higher. I'm not one to argue with the market as long you have strict risk and profit management rules in place. Several mergers and big dividends are about to close and get distributed. This will add alot of liquidity to drive the markethigher. On top of the economy reaccelarating, andchristmas just around the corner, it looks like itwill be a merry christmas and a happy new year for themarkets. Leading stocks, continue to lead. Even asthe market has had some bouts with distribution days,they have held up nicely, and have corrected modestly.Earlier this year, the exact opposite occured,leading stocks came crashing back into bases as themarket got sold off. Hold onto your winners as longas they are not showing sign of weakness, and look fornew buys that maybe setting up for the next leg up.Oil could still pose a short term problem, but as soonas it stabilizes the market just discounts it andmoves higher. The rally that started in late Augustis still intact. We got rally confirmation days onall the indexes, even though the DOW needed to do ittwice since it undercut it's August rally low, on theSpitzer affect. Volume has been running much heavier on up daysthan down days. Look back at MArch 2003 and you will see alot ofsimilarities between the two markets. Earlier this year, everyrally was followed by heavy selling in the indexes. The advancedecline has also been trending higher since August. The 20 and 50DMA have crossed overon both the NASDAQ and S&P, and we're just waiting onthe DOW. The S&P has been the leader so far thisyear, but that may change as the NASDAQ ramps up. Nomatter which index leads, just look for the leadingstocks. If you haven't particiapted up to now, there are stillopportunities out there, you just need to look for them.
Wednesday, November 01, 2000
October Market Update
The market took us on another roller coaster ride during the month of October. The market started down in the beginning of the month on the typical concern that we will have another crash, such as the one's in 1929, 1987, & 1998. Adding to the downdraft was Intel's earnings report. Intel reported earnings that were two cents lower than expectations, caused by lower average selling prices of its chips. Dell warned that its quarter would miss as a result of higher DRAM prices, due to the Taiwan earthquake, making Wall Street wonder about the true extent of the earthquake. IBM stated that its 4th quarter wouldn't meet expectations due to Y2K spending slowdown, which brought the Y2K issue back to the forefront of concern. The Producer Price Index (the "PPI") came in at 1.1%, sending the market spiraling down, rejuvenating concern that inflation is bearing its ugly head, and sending the 30-year bond close to the 6.4% level.
The market did an about face around the middle of the month when the Consumer Price index (the "CPI") failed to confirm the inflation picture that the PPI portrayed. It became evident that the PPI's spike was caused mainly by the increase in oil and cigarette prices. Intel, after dropping the earnings bomb on the market early on, had an upbeat meeting with analysts, introducing the new family of chips, stating that their 4th quarter will be strong, and that they don't see any Y2K slowdowns in their business. To top it off, the final economic indicators, the GDP, came in at a strong 4.8%, and the two inflationary indicators, GDP chain deflator and employment cost index, came in below expectations, confirming that the economy continues to experience good growth with low inflation. The good economic news sent the long bond yield down to 6.2%, adding the third component that the stock market likes, lower interest rates.
The month ahead will be a challenging one. Y2K is still a major issue on the minds of investors, and any hint that it may cause disruptions could cause another market downturn. The Employment Payroll Report, which shows job growth and increases in hourly wages, will be an important one on the 5th of November. The PPI on the 10th and the CPI on the 17th will be closely watched, especially after the 1.1% spike by the PPI in October. The Federal Reserve Committee meeting on the 16th is the all-important date. We will find out the Fed's plans for interest rates going forward. The consensus seems to be that the Fed will raise rates by 25 basis points. And of course some more earnings, but they'll be secondary drivers.
The market did an about face around the middle of the month when the Consumer Price index (the "CPI") failed to confirm the inflation picture that the PPI portrayed. It became evident that the PPI's spike was caused mainly by the increase in oil and cigarette prices. Intel, after dropping the earnings bomb on the market early on, had an upbeat meeting with analysts, introducing the new family of chips, stating that their 4th quarter will be strong, and that they don't see any Y2K slowdowns in their business. To top it off, the final economic indicators, the GDP, came in at a strong 4.8%, and the two inflationary indicators, GDP chain deflator and employment cost index, came in below expectations, confirming that the economy continues to experience good growth with low inflation. The good economic news sent the long bond yield down to 6.2%, adding the third component that the stock market likes, lower interest rates.
The month ahead will be a challenging one. Y2K is still a major issue on the minds of investors, and any hint that it may cause disruptions could cause another market downturn. The Employment Payroll Report, which shows job growth and increases in hourly wages, will be an important one on the 5th of November. The PPI on the 10th and the CPI on the 17th will be closely watched, especially after the 1.1% spike by the PPI in October. The Federal Reserve Committee meeting on the 16th is the all-important date. We will find out the Fed's plans for interest rates going forward. The consensus seems to be that the Fed will raise rates by 25 basis points. And of course some more earnings, but they'll be secondary drivers.
Monday, August 07, 2000
Markets - What a Wedgie
If you're getting excited about the action of the last few days, I have some potentially bad news. This is the same exact action we saw in the markets in the middle of the March/April Sell off.
All three major indexes, DOW, NASDAQ, & S&P have been wedging higher. That is, rising while volume has been drying up. What does this mean to you? Even though the markets have been rising, the conviction of institutions to fully commit has been lacking. Without them, the current rally doesn't stand a chance.
All three major indexes, DOW, NASDAQ, & S&P have been wedging higher. That is, rising while volume has been drying up. What does this mean to you? Even though the markets have been rising, the conviction of institutions to fully commit has been lacking. Without them, the current rally doesn't stand a chance.
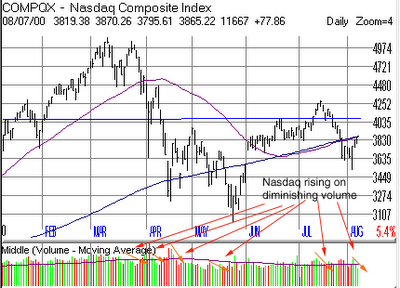 Also interesting, the short ratio topped out almost at the same time the market started to rally in early June. Enforcing the idea that the current rally was nothing more then a short squeeze. The bull/bear and put/call ratios also never saw the extremes that these ratio exhibits when firm bottoms are made, and the DOW and NASDAQ are below their 200 day moving averages.
Right now is a good time to be cautious. There are a lot of contrarian indicators pointing to further declines in the markets, but look for upcoming economic numbers to potentially add fuel to this rally. The market should rally strong if the economic numbers are good. If they don't, then put the red flag up, and start waving it.
The market has now entered it's worst three months of the year. If the past is any indication, then don't look for this current rally to materialize into anything more then a bear trap.
I have one prediction. If this rally is a bear trap and the market does sell off, look for a bottom to be put in late August or early September. Why? Everyone is on to the fact that the market has bottomed in October for the past few years. I believe that these people will sell off their holdings earlier in anticipation of the bottom, and position themselves back in stocks earlier to try and take full advantage of the bottom.
Good Luck!!
If you have to remember anything, remember the following:
Cut you losses short. Let your winners run, not your losers.
Sunday, August 06, 2000
Kulicke & Soffa - KLIC
Here is a great example of why all the research in the world wouldn't have clued you in to the earnings warning to come from KLIC on 8/3. But looking at the chart, you would've realized that something fishy was going on.
Looking at the weekly chart below, the stock broke out of a year long cup and handle pattern, and went on to move 124% over the next three months before topping out with the rest of the market in March.

 The stock was also part of the strong semiconductor equipment group, which almost every analyst on the street was touting the strong fundamentals, and how the cycle of growth would continue into at least next year. But what do they know?
If you were lucky enough to ride the stock out of the cup and handle, good, but if you didn't get out, you're sitting on a nice loss, bad!!
So how would you have know to get out? Volume wasn't much of a factor in this chart. If you look at the move up or even down early on there wasn't much distribution. The two big days of distribution days on 3/16 and 4/4 were more like accumulation days, as the stock recovered from major sell offs those day to close in the upper range of the day.
Confused yet? Well, good, then your learning that you need to add other sell indicators to your arsenal. In this case the drop below the 50 day moving average on 3/14 should've gotten you out of the stock. If you were stubborn and didn't get out you probably swallowed your heart over the next few days as the stock fell all the way down to 20, the breakout level of the cup and handle pattern, before reversing higher. At that point you were thanking god that the stock began to move higher. The stock proceeded to power through it's 50 day moving average on higher volume. So you thought you were out of the woods, and were able to pick up those cocktail party discussions. Ha!!! Boy were you wrong. The stock continued higher for a few more days but on absolutely no conviction, and then crashed through the 50 day moving average on heavy volume. If you didn't get out here then you were asking for trouble, as the stock tested the $20 level again. At this point a descending triangle began to form. If you at least recognized this bearish pattern forming, you still could've gotten as the stock tested the upper range of the triangle and the 50 day moving average several more times, and failed to break throughor hold above. OK, if you're still in the stock, then the break through the 200 day moving average on 7/21 should've been a final warning that you should take your profit and run.
At this point emotion begins to take over. Traders start to question their selling ability. The most common thought, it's down so far, it can't possibly go lower considering it's in a strong sector. Well, if you were paying attention to the SOX index, you would've realized that the sector the stock was in was on the verge of breaking down itself (Read the 7/31 Stock of The Week, where MB. featured this potential breakdown).
So what's the conclusion? Somebody obviously knew something we didn't know. This was a well orchestrated distribution, as volume didn't clue us in. But the constant breakdown below the 50 day moving average, was a good sign that the institutions were up to no good. This level and the 200 day, are usually where the institutions like to do their buying and selling. So the warning on August 3rd shouldn't have been to much of a surprise. You had plenty of opportunities to get out, hopefully you took them. If not, learn from this experience and don't make the same mistake again.
Good Luck!!
Looking at the weekly chart below, the stock broke out of a year long cup and handle pattern, and went on to move 124% over the next three months before topping out with the rest of the market in March.

 The stock was also part of the strong semiconductor equipment group, which almost every analyst on the street was touting the strong fundamentals, and how the cycle of growth would continue into at least next year. But what do they know?
If you were lucky enough to ride the stock out of the cup and handle, good, but if you didn't get out, you're sitting on a nice loss, bad!!
So how would you have know to get out? Volume wasn't much of a factor in this chart. If you look at the move up or even down early on there wasn't much distribution. The two big days of distribution days on 3/16 and 4/4 were more like accumulation days, as the stock recovered from major sell offs those day to close in the upper range of the day.
Confused yet? Well, good, then your learning that you need to add other sell indicators to your arsenal. In this case the drop below the 50 day moving average on 3/14 should've gotten you out of the stock. If you were stubborn and didn't get out you probably swallowed your heart over the next few days as the stock fell all the way down to 20, the breakout level of the cup and handle pattern, before reversing higher. At that point you were thanking god that the stock began to move higher. The stock proceeded to power through it's 50 day moving average on higher volume. So you thought you were out of the woods, and were able to pick up those cocktail party discussions. Ha!!! Boy were you wrong. The stock continued higher for a few more days but on absolutely no conviction, and then crashed through the 50 day moving average on heavy volume. If you didn't get out here then you were asking for trouble, as the stock tested the $20 level again. At this point a descending triangle began to form. If you at least recognized this bearish pattern forming, you still could've gotten as the stock tested the upper range of the triangle and the 50 day moving average several more times, and failed to break throughor hold above. OK, if you're still in the stock, then the break through the 200 day moving average on 7/21 should've been a final warning that you should take your profit and run.
At this point emotion begins to take over. Traders start to question their selling ability. The most common thought, it's down so far, it can't possibly go lower considering it's in a strong sector. Well, if you were paying attention to the SOX index, you would've realized that the sector the stock was in was on the verge of breaking down itself (Read the 7/31 Stock of The Week, where MB. featured this potential breakdown).
So what's the conclusion? Somebody obviously knew something we didn't know. This was a well orchestrated distribution, as volume didn't clue us in. But the constant breakdown below the 50 day moving average, was a good sign that the institutions were up to no good. This level and the 200 day, are usually where the institutions like to do their buying and selling. So the warning on August 3rd shouldn't have been to much of a surprise. You had plenty of opportunities to get out, hopefully you took them. If not, learn from this experience and don't make the same mistake again.
Good Luck!!
Monday, July 31, 2000
Noven Pharmaceuticals - NOVN
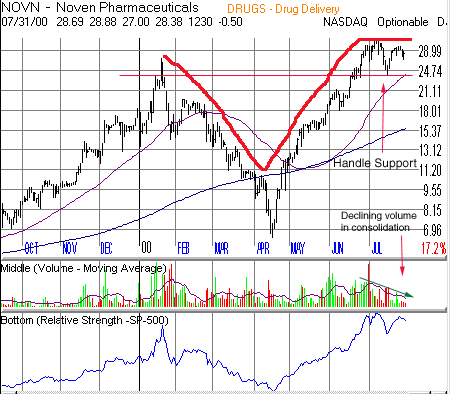
Here's a stock worth keeping an eye on. The stock is in the final stages of forming a cup with handle pattern. It has been forming a downward wedging handle for four weeks on declining volume. Exactly the type of price and volume action you'd like to see at the end of a cup and handle formation. This type of action shakes out the week holders.
The price inside the handle needs to hold above support at around 23.75 or the whole pattern could be rendered a failure, and may present a shorting opportunity under the support level.
Fundamentally the stock is starting to hit its stride. The company is expected to grow 100% this year, and 65% next year. Its five year projected growth rate is 40%. Analyst have been raising their estimates quite consistantly for the next two quarters and years.
Look for the stock to break the high of its handle at 31.875 before initiating a position. If the stock breaks out on heavy volume and continues higher, it could double rather quickly. But of course, either your stop loss, or the action in the price and volume will guide your sell decision.
Remember: 7% stop losses from your buy point on all trades, or whatever you're comfortable with. Preserve your capital, and you will live to fight another day. Lose it, and back to mutual funds you go.
Sunday, July 30, 2000
Techne Corp. - TECH
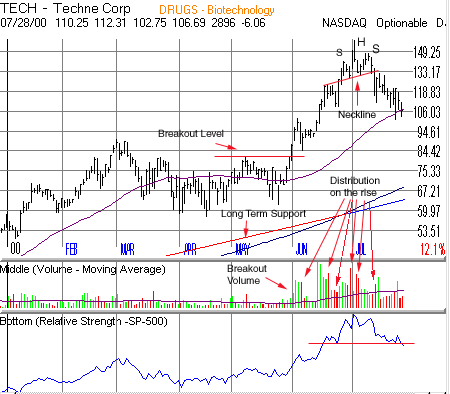
Techne Corp. was one of the first stocks to breakout in the most recent rally. If you were lucky enough to get in on the breakout, and get out near the top, you saw your investment appreciate approximately 95% in less then a month.
The stock broke out of a 12+ week base on heavy volume. The handle of the base which lasted about 3+ weeks was a bit sloppy, but the sloppiness came on low volume. If you missed the initial breakout because of the sloppiness, and the sharp move from the bottom of the base through the breakout area, you got a second chance to enter the stock as it paused for about 7 days, and consolidated in a triangle formation. The stock broke out of the triangle on extremely heavy volume and proceeded to around 120, where it paused again to consolidate its move before making its final advance. Up to this point the stock had experienced three distribution days. The first one wasn't concerning as it came right after a big breakout. The second one, again, wasn't to concerning as it too came after a big move. But this one should've raised a cautionary flag, as the volume was extremely heavy. The third distribution day came two days after the second, on above average volume, but nowhere near as heavy as the first two. The stock then proceeded to breakout of that consolidation and head higher on what would be its final run, and the formation of a head and shoulder top. A fourth day of distribution came quite quickly, and on the heaviest volume since the run began, forming the left shoulder. The yellow flag should be up and waving at this point. The run the next day to new high's on just average volume should have put up the red flag. The following day the stock ran up on the open 12 points, only to reverse course and close down 5+ points on extremely heavy volume, forming the head, and logging the fifth day of distribution. This should've been the your final warning, and put up the checkered flag, as this signaled that the stock had run its course, and this was the time to get out, or at least to move up your stop loss to the previous consolidation.
If you were still in the stock at this point, you got another chance to get out with a handsome profit. The stock tried to rally, but the rally came on decreasing volume. Some tried to argue that the volume was above average. But a closer examination would've revealed that it didn't compare to the volume during the rest of the move or the last two distribution days. The sixth day of distribution was then logged, forming the right shoulder and breaking down through the neckline. You could've gotten out at this point, and still would've held on to your profits even if you would have bought the stock as late as the third consolidation in the 120's.
Remember, 4 to 5 distribution days is enough to topple a stock or an index.
Even though the stock has experienced two days recently that look like solid accumulation, big volume spikes on price surges, the stocks relative strength line has broken down. If you read the article on the SOX index, then you know that a breakdown of the relative strength line, is usually a good precursor to what's to come for a stock or index.
If you're still holding the stock, you may be asking for trouble. Those that bought on the first two breakouts still have a profit, everyone else is now sitting on a loss.
Good Luck!!
PMC Sierra - PMCS
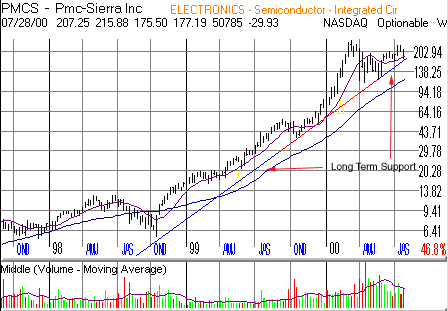
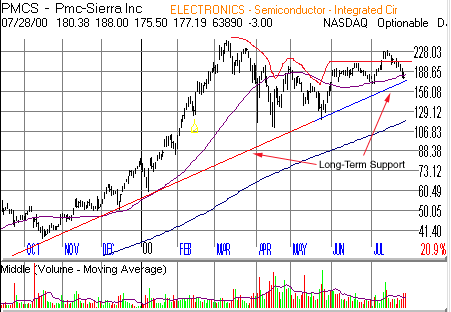 This stock has been one of the stocks recently that has broken out on heavy volume, only to breakdown almost immediately.
The stock had formed a double bottom formation with a handle. The volume during the double bottom formation had acted well. The volume was heavy on the first sell off, then was heavy, but not as heavy as the first sell off, on the second sell off, and the volume in the handle dried up, before the stock broke out on heavy volume.
As is usually common, volatile stocks such as PMCS typically follow the path of the market, and began selling off about two weeks ago, rendering the breakout a failure. But there is short term hope on the horizon.
The stock, as well as the market, are extremely oversold at this point and are due for a technical bounce, also know as a 'dead cat bounce'. The stock is also approaching a critical support line that has dated back to the end of 1998. It has bounced off this support several times, and looks as if it is about to find support there again. One clue I find interesting is that the stock only sold off moderately on Friday as the NASDAQ had its biggest point loss in some time, meaning the selling pressure is moderating.
It would be risky to try and buy the stock before testing the support level, as a dead cat bounce is not guaranteed. Look to enter the stock at around 172, but watch the market on whether or not to reconsider the buy decision. If the market isn't reversing to go higher, avoid the stock, until the market reverses direction to the upside.
If you do enter the trade on the long side, don't overstay your welcome with greed. The stock may try and bounce to the $200 level. Volume will be crucial. If it is declining during the recovery, then your sell signal will be the day the stock undercuts the prior days low. This would be a good point for the high risk trader to initiate a short position.
Remember: 7% stop losses from your buy point on all trades, or whatever you're comfortable with. Preserve your capital, and you will live to fight another day. Lose it, and back to mutual funds you go.
Diamonds - Here's One Your Girlfriend Won't Want
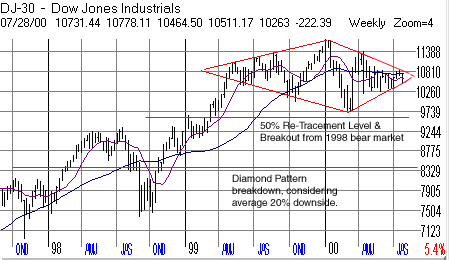
If you're a diamond lover, this article might change your mind. Diamond formations on a chart, particularly an index, are extremely rare. But when they do form they often signal a major bear market on the average of 20% from the breakdown point. The only good thing, the formation has a high failure rate of about 25%.
The DOW has formed a huge one year diamond pattern. The closing price, 10,511, on Friday was right at the breakdown point, and the index was running close to the end of the apex. A breakdown from here would surely send the index tumbling. Its first support level would be around the March low of 9,600, which is also its 50% re-tracement level, measured from its 1998 low to its 2000 high divided by two. This would almost put the index in bear market territory, which the NASDAQ has already seen.
A breakdown below the 50% re-tracement level, would surely put the index firmly into bear market territory, as the bears try and take the index down to the diamond formations average breakdown of 20%, or approximately 8,400 (measured by taking the breakdown level of approximately 10,511 x .80). The index could find support at around 8,775, but it would be weak support.
Tread lightly, as the NASDAQ has come under some selling pressure itself lately. A bounce is likely in the cards for this week as the indexes have experienced some heavy selling over the last week. Any bounce will postpone the diamond breakdown, but watch the volume for clues. If the rally comes on lower volume, and then reverses on a pick in volume, don't stick around to see what happens. Take your profits and run, or short if you can handle it.
Good Luck!!
If you have to remember anything, remember the following:
Cut you losses short. Let your winners run, not your losers.
Thursday, July 27, 2000
Broadcom - BRCM
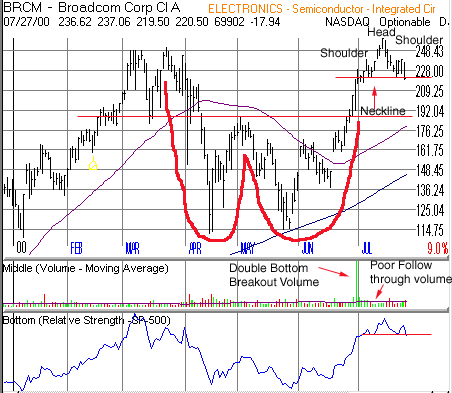
This stock is a day traders dream. Once it gets going one way or another, there is some serious profits to be made. Unfortunately for BRCM shareholders, the current direction looks down.
The stock broke out of a double bottom formation in late June on heavy volume. But that first day was the only good thing about the breakout. The stock proceeded higher on below average volume, which indicated a lack of interest on the part of the institutions to accumulate the stock.
The stock has now formed a potential head and shoulder top. It is currently sitting right at the neckline. Its relative strength line is on the verge of breaking down. A break below the neckline, under 220, could take the stock under 200, to the breakout level of the double bottom around 188.
The stock is closely related to the SOX index, so if the breakdown in the index is any indication, the stock should follow suit. One important warning, don't overstay your welcome if the market turns up. The reason I say the market, is that even if the stock is weak, a strong market will most likely pull this bad boy higher, and fast. A small profit could turn into a big loss in a blink of an eye. This short is for investor who can watch the stock closely during the day. If you do short BRCM and get stopped out, don't be afraid to re-enter the short again. The market is most likely getting oversold and is due for at least a technical bounce over the next few trading days.
Remember: 7% stop losses from your buy point on all trades, or whatever you're comfortable with. Preserve your capital, and you will live to fight another day. Lose it, and back to mutual funds you go.
Wednesday, July 26, 2000
Advanced Micro Devices - AMD
If you haven't read it yet, then go back and read this weeks stock of the week column on the SOX index and AMAT, before reading today's daily setup. To summarize the article, Mike B. wrote that he thought that the index was on the verge of breaking down, and taking the stocks in it and related to it down with it. Guess what, the index broke down, and many of the related stocks are on the verge of collapse. AMD is one of those stocks.
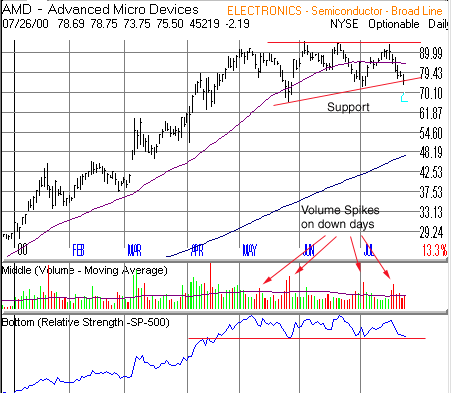
This stock was one of the only stocks that ran higher during the March/April sell off. At a first glance at the chart, the stock looks like it is forming an upward trending triangle, which is a bullish consolidation. It seems like the stock is trying to digest the big gains made from its run since the end of last October. But if you look at the volume action throughout the consolidation that started back in May, the picture gets outright bearish.
Over the 12+ weeks the stock has been consolidating, it has logged 20 distribution days compared to 6 accumulation days, 5 of which came on pretty lame volume. The other one, on 6/5, the stock tried to breakout on higher volume, could be considered a distribution day as the stock ran up on high volume and closed in the bottom of that days range. Notice also the large amount of spikes in volume on down days. The last six days alone have logged 3 distribution days.
Intel the leader in AMD's category has come under heavy distribution lately too. The report on slowing PC sales, doesn't help the stock either, as its micro processor division makes or breaks the company. The breakdown in the SOX is a further negative and could be the final straw that breaks this camels back.
Anyone who reads Investors Business Daily should've taken notice that even as the stock was approaching its highs, the accumulation/distribution rating, which measures institutional buying or selling interest, was a D, signaling that institutions were unloading their shares. This rating and the volume spikes on down days gave you two of the best clues that the stock was resting only to go lower. It looks like the institutions were unloading the shares while the news was good, and amateur investors were scooping it up not to miss the next leg up. It looks like their not going to enjoy the next leg down as it kicks them in the balls. Maybe the big boys know something we don't. Hmmmmm? Only time will tell.
This stock look like a short under 76.5. The stock is just on the edge of breaking down below its 2 month up-sloping trend line. It actually broke the trend line today on heavy volume, but managed to close just on the border. Look for a continuation move down tomorrow, and enter if you can handle the potential volatility. Conservative short players may want to wait for the stock to take out its July low of 72 1/2, as this level could act as initial support from the trend line breakdown. The next support level is 66, the May low, after that the stock could fall to 61, and finally the 200 day moving average at around 48. Follow the SOX index for clues as to when and where the stock may find a bottom.
Just to let you know, I shorted the stock today at 76 1/2.
Remember: 7% stop losses from your buy point on all trades, or whatever you're comfortable with. Preserve your capital, and you will live to fight another day. Lose it, and back to mutual funds you go.
Tuesday, July 25, 2000
Hewlett Packard - HPQ
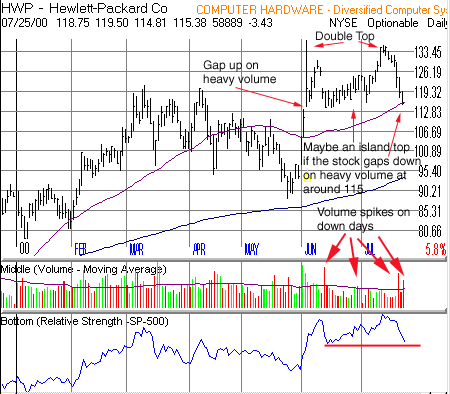 Mother Russia is going to be proud of me. Tonight's daily setup, HWP, another one of America's darlings, has set up as a short.
Fundamentally the stock has gotten some bad news from outside itself. The stock sold off on heavy volume on Friday when Agilent warned of a shortfall in earnings for the quarter, and adding to the pressure was the report yesterday showing that PC sales are slowing down.
Technically this chart is just sickening. Ever since the stock peaked on 6/5 it has logged 7 distribution days. 4 of those distribution days came on volume spikes. The last attempt at its high came on waning volume, signaling that the stock maybe tired, and forming the second top in the double top formation. The stock is a short under 115 1/2, which was broken today on heavy volume. The stock also closed below its 50 day moving average, and is pretty close to making a lower low on its relative strength line (it actually made a lower low on the weekly chart below) further enhancing the bearish scenario. An island top will be created, if, over the next several days the stock were to gap down in this area on heavy volume to go along with its gap up on heavy volume on 6/5.
Looking at a longer term chart (see below), there are two major support lines. The stock has been trending higher since the stock bottomed at the end of October last year. During the last sell off, the stock found support, and bounced higher off of this trend line, which corresponded with the stocks breakout out of a cup and handle pattern earlier this year (man those long term charts can be helpful).
Conservative short players may want to cover off the trend line support currently at around 106, unless the stock slices through there on heavy volume. The next stop if that happens is 92 1/2, the area of the cup and handle breakout, and currently around the 200 day moving average. If you do cover at 106, and the stock bounces higher watch the volume. If the bounce comes on low volume then keep your eye on the stock as a possible re-entry short if it breaks the trend line. Also keep in mind that the 200 day moving average is trending higher, and could act as support before the stock reaches 92 1/2.
One more thing. The stock is due to report earnings in early August, so this breakdown in the stock could be a preview of a possibly poor report. But, if the stock starts to show accumulation over the next few days, don't over stay your welcome on the short side.
Just to let you know, I shorted the stock today at 115 1/2.

Remember: 7% stop losses from your buy point on all trades, or whatever you're comfortable with. Preserve your capital, and you will live to fight another day. Lose it, and back to mutual funds you go.
Monday, July 24, 2000
Microsoft - MSFT
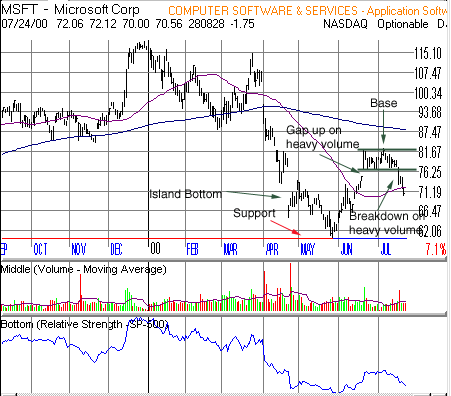
This is going to be my communist pick of the year. Short Microsoft. Did I say that? Yes, short Mr. Softee!!! Why? It stinks, the chart is a mess, the fundamentals are a mess, and all this points to no where but down.
I wasn't this bearish on the stock a few days ago. In fact I was looking to go long, but how things change over the course of just a few days. The stock had put in an Island bottom, followed by a gap up on heavy volume into a flat base to consolidate its move from the low 60's, and looked like it was getting ready to attack the high 80's. But all that came crashing to a halt when the stock sold off and broke down out of its base on heavy volume after reporting earnings on 7/19. The stock has now formed an intermediate island top. The sell off today through the 50 day moving average and the declining relative strength make the stock an even better short and most likely will force MSFT to test its support level in the low 60's. I would be a short seller of the stock under 71.
The companies fundamentals aren't looking good either. For a stock that is supposed to be dominating the world, 13% revenue growth is quite paltry. Earnings? What a joke those are. The company has used realized gains from sale of investments to make them look good. So what you say? Your not buying the company because they are in the business of making investments for you. You buy them for their operations in software, which doesn't seem to be growing so fast anymore. Think about it this way, if the market were to crash, devaluing their investments, or MSFT sold out of all their investments, they would have nothing left to hide the poor performance of their software business. Realized gains are one time events. Once they are gone, they are gone unless you can keep making good investments. If that is what MSFT has become, then let them tell us that, and we'll value them as if they were a mutual fund, or an incubator, rather then a software company. Think about it another way. If the use of realized gains to make earnings look good was ok, then why weren't analyst pounding the buy recommendations on 7/19? Why weren't the mutual funds scooping it up at these bargain basement levels? The chart says it all, they want out. Don't believe the guest on CNBC when he says he loves MSFT at these levels. What is he supposed to say? I hate the stock I own 10,000,000 shares of and I want you to sell it so I can get killed. I don't think so.
The Justice Department is another thorn in their side. As long as the anti-trust case goes on, it will distract the company from doing what they have to do to stay as the top software company. There is no way they will be permitted to bundle any other critical piece of software with their operating system or make an acquisition that may strengthen them. Joel Klein will see that doesn't happen.
If you're skeptical about initiating a short right now, wait and see what happens. If the market turns northward, the stock may attempt to rally to the bottom of the base it broke down from at around 76. Watch the volume. If the stock does rally, but on light volume, then initiate the short on the day it stops moving higher and reverses.
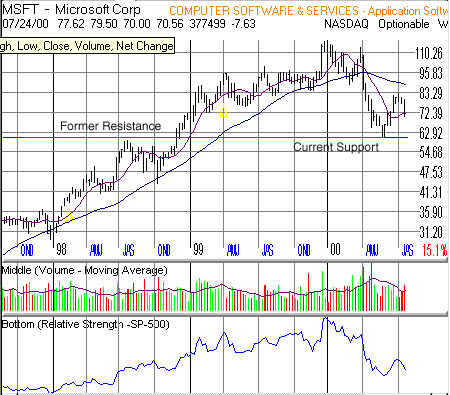
Here is a chart lesson for some of you. Notice on the chart below how the low 60's, the exact spot the stock found support at during its prior sell off, happens to be a resistance level the stock ran into back in 1998. It is always important to look back in time to see if you can identify spots where the stock will find some buying support, this will help you identify the potential fall after the stock has broken down. For long term investors, it could identify a spot to initiate a new position. For short seller it identifies a spot they may want to cover at. For traders it identifies a spot where the stock can bounce for a few point gain.
What if the stock breaks the support in the low 60's? Well if it comes on heavy volume, their is a minor support at around 55, the middle of a double bottom the stock formed in 1998, and a major support at 47, the bottom of the double bottom formed in 1998. Long term investors, good luck. Hey, you never know, I might just join you if the chart changes. That's the beauty of technical analysis, love them one day, hate them the next. And it's not always in days, in can be in minutes.
Just to let you know, I shorted the stock today at 71.
 Remember: 7% stop losses from your buy point on all trades, or whatever you're comfortable with. Preserve your capital, and you will live to fight another day. Lose it, and back to mutual funds you go.
Sunday, July 23, 2000
Cisco Systems - CSCO
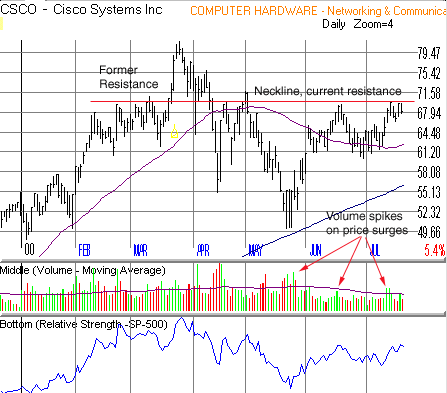
I got to say, CSCO is looking good here. It is in the process, actually at the end of forming a head and shoulders bottom pattern. Notice the spikes in volume on price surges, signaling accumalation. The bullish bottoming formation and the accumulation signals make CSCO a potential buy if it can break 69 7/8, the neckline of the head and shoulder pattern, on heavy volume, at least 50% greater then the 50 day moving average. Also, notice how the neckline acted a resistance back in February and March. This indicates there was/were a big player(s) that wanted out at these levels. Now the question remains, is/are those player(s) done selling here. If it does breakout, that'll be your signal that they're done for now and the stock should challenge its all time high of 82, at which time it would have completed the cup of a potential cup and handle pattern. At that point the stock should pause and form a handle that consolidate its gains, and wedges lower for a few weeks to shake out the remaining weak holders.
Of course CSCO moves with the market, and if the market fails to advance it will take CSCO down with it. If this happens I can see CSCO testing its low of 50, as it proceeds to form a double bottom pattern. So don't overstay your welcome on the long side if the market starts to look weak over several days.
If you're a long-term investor looking to initiate a position, I would like the stock to head down and test its long term trend line, dating back to its IPO, at approximately $42/share. But remember, this line is sloping upward, so everyday that passes, the area I would like CSCO to test is rising. If the market were to tumble over the next few weeks, this line may move into the high 40's to low 50's strengthening the support for the stock in that area. Long term investors may want to watch this area as a place to initiate a position. A prolonged breakdown below this level, could signal that good days for CSCO are over.
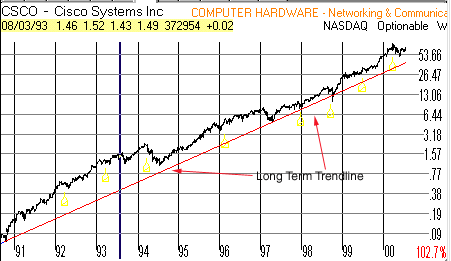
In conclusion, I'm looking to go long right now at above 69 7/8, but, if the market turns I will look to short. In either case I have a plan, now it's time to execute.
Remember: 7% stop losses from your buy point on all trades, or whatever you're comfortable with. Preserve your capital, and you will live to fight another day. Lose it, and back to mutual funds you go.
Friday, July 21, 2000
Semiconductor Index - SOX & Applied Materials - AMAT
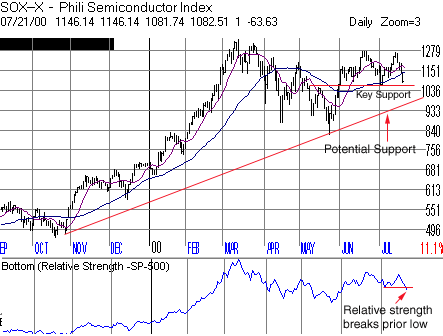
One of the leading index's over the past year has been the Semiconductor Index, a.k.a "The SOX". This index over the past several weeks has become more volatile as several leading stocks in the index have broken down from their bases.
One indicator that traders look at heavily is the industries book to bill ratio, which indicates the amount of orders coming in compared to the amount of merchandise being shipped out. A ratio above one is positive as it indicates that the companies are getting in more orders then they are shipping out. In the June quarter the book-to-bill ratio was 1.26, which is down from the previous month of 1.46. Although the indicator is over 1.00 it is starting to decelerate. This indicator has to be watched very closely, as it is usually a predicator of what to expect from these companies as far as earning and sales are concerned going out several months.
Another thing that is very disturbing is that the indexes relative strength made a lower low. The relative strength gauges the strength of the index compared to the S&P 500. It's breakdown is usually a precursor to future down moves in the index. This will be confirmed if the index breaks its key support level of 1065.64. Also watch the leading stocks in the index such as; AMAT, NVLS, TQNT, and others.
Let's take a look at the chart of AMAT, one of the leading stocks in the index. First, let me note that the stock has broken its uptrend and it seems to be in the process of rolling over. Second, the relative strength has already broken one low, and is on its way to breaking its lowest low that was set back in April. If this is broken in the next week or two, it will confirm the downtrend and the possibility of continued lower prices.
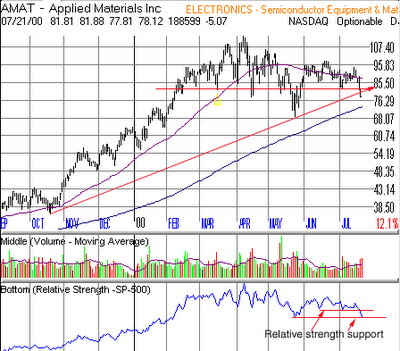
In additon, earnings and sales are great for this company and the industry. Expectations are running high, so any disappointment or lack of phenominal surprise, will be disastrous for the stocks in this index.
One final note, the weakest part of the year is coming, August - October. Investors should be very cautious on what they buy, monitoring the markets and their stocks carefully, and honor thy stops religiously!!!
Thursday, July 20, 2000
FTI Consulting - FCN
 If you were looking for a micro-cap stock that has the potential to run, then FCN is the company to do it.
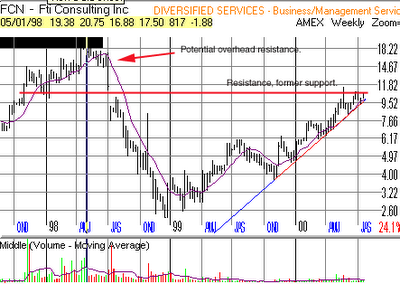
The stock has been trending higher since November 1999 with pauses in between. The stock is currently in a 9 week cup and handle pattern. Volume has steadily dried up since the stock peaked on May 22nd, indicating that there aren't many sellers. During the course of the nine week consolidation there have been three price surges on above average volume, indicating heavy accumulation.
The stocks pivot point, breakout point, is 10 7/8. Look for a breakout on above average volume. If it can clear this pivot point, it should head higher to 14, where it may encounter resistance from some overhead supply left there after its early 1998 collapse. It will be healthy to see the stock pause at that level, and shakeout out the remaining weak holders, if any are left, and then attack and take out the old high at 19 3/8. Notice on the chart below, how the current resistance level coincides almost exactly with a former support level. It's always a good idea to look back at a long term chart to see if anything could be standing in your way.
But be careful with this one. The daily volume is thin, so the volatility could shake you out quite quickly. If it does, so be it, but don't let it piggy back you down with it if it turns down.
Remember: 7% stop losses from your buy point on all trades, or whatever you're comfortable with. Preserve your capital, and you will live to fight another day. Lose it, and back to mutual funds you go.
Wednesday, July 19, 2000
Siebel Systems - SEBL

Here is a stock for those looking to enter an aggressive short position. Siebel Systems had formed a 14 week cup with a handle pattern, and broke out on 7/7 on average volume, which was the first sign that the stock was doomed to fail. Typically you'd like to see the stock break out on volume that is at least 50% higher then its 50 day moving average. The next two days it proceeded to pullback into the handle base on below average volume. On 7/12 the stock broke out again, but this time on below average volume. It continued higher for the next two days with no sign of volume pick up, which translated into a lack of conviction by the institutions to accumulate the stock. The second sign the stock was going to fail. Without the buying power of the institutions, stocks typically will not have enough power to move higher by themselves. On 7/17 the stock reversed course and started heading lower. The volume started to pick up as the stock headed lower, and today as the stock came back into the handle base, the stock fell 7 7/8 on volume that was 50% greater then the 50 day moving average. It looks like the stock wants to form a longer handle which will shakeout the rest of the weak holders, setting up for a future possible breakout.
The stock is a good short anywhere just under 170 1/2, which is the breakout point. The stock should head lower to approximately 147, which is it's 50 day moving average and bottom of the handle. If the stock breaks through this point on heavy volume, the bottom is anyone's guess, but I would say it would be around 120.
Keep your stop loss at 7% of your purchase price or right above the breakout point of 170 1/2 (for more conservative traders). This stock is volatile and may try to breakout again. If it does, be prepared to enter on the long side. If the volume is not above average look for the stock to pull back into the base, and become a short candidate once again. This stock tends to follow the market, so make sure you take that into consideration when deciding where to cover the short.
Remember: 7% stop losses from your buy point on all trades, or whatever you're comfortable with. Preserve your capital, and you will live to fight another day. Lose it, and back to mutual funds you go.
Can You Feel The Pain
This day couldn't end any sooner. In fact, I would've pulled the plug myself, if they let me. No, better yet, I would've thrown myself on the transformer if I knew it would blow out the power.
I couldn't pick a winner over the last two days, if you gave me tomorrow's paper. Actually, everything I bought, broke out on heavy volume, except they ended up failing. But that's what trading is about. You win some, you lose some, but in the end the dollar amount of winners exceeds the dollar amount of losers, hopefully.
The NASDAQ ate alot of us for lunch over the last two days after a somewhat confusing CPI report. After last weeks phenominal run, on heavy volume, it looked like maybe the market would throw us a bone, and let some of the new breakouts run or at least hold above their pivot points. Wrong!!!! It actually decided to pull back to its 50% retracement area on lighter volume, and have most of the recent breakouts fail (For me, this means all). The lighter volume, and the good breadth yesterday, was actually quite consoling. These two indicators, make me believe that the market is just taking a well needed breather, and continues to confirm that large caps are weighing down the averages. If we're going to have down days, these are the type you want to see.
Even though I believe that we're almost ready to resume the uptrend, I will be fishing through the charts tonight to find some shortable candidates. My buy list is pretty long, but most of the stocks on it have retreated some from their breakout points.
This is not the time to get emotional. Don't try to show up the market by doubling down or moving down your stops. Let your stops hit, and look for other opportunities, whether long or short. You may even get a chance to re-enter the stopped out stocks on a re-breakout or breakdown. If I'm right and this is only a pause, the breakouts will come again.
Tomorrow Alan Greenspan speaks, and everyone will be listening. If his speech hints toward more interest rates hikes the markets will fall back into it's most recent base. If the volume increases, and the market can't hold inside that base, we're headed for the May low, in my opinion of course.
If this rally proves to have been a bear market rally, then the market has formed the left side of what I believe will be a double bottom pattern. In any case, I'll be ready after tonight, even though I should've been ready already, to capitalize on the downturn.
If you have to remember anything, remember the following:
Cut you losses short. Let your winners run, not your losers.
I couldn't pick a winner over the last two days, if you gave me tomorrow's paper. Actually, everything I bought, broke out on heavy volume, except they ended up failing. But that's what trading is about. You win some, you lose some, but in the end the dollar amount of winners exceeds the dollar amount of losers, hopefully.
The NASDAQ ate alot of us for lunch over the last two days after a somewhat confusing CPI report. After last weeks phenominal run, on heavy volume, it looked like maybe the market would throw us a bone, and let some of the new breakouts run or at least hold above their pivot points. Wrong!!!! It actually decided to pull back to its 50% retracement area on lighter volume, and have most of the recent breakouts fail (For me, this means all). The lighter volume, and the good breadth yesterday, was actually quite consoling. These two indicators, make me believe that the market is just taking a well needed breather, and continues to confirm that large caps are weighing down the averages. If we're going to have down days, these are the type you want to see.
Even though I believe that we're almost ready to resume the uptrend, I will be fishing through the charts tonight to find some shortable candidates. My buy list is pretty long, but most of the stocks on it have retreated some from their breakout points.
This is not the time to get emotional. Don't try to show up the market by doubling down or moving down your stops. Let your stops hit, and look for other opportunities, whether long or short. You may even get a chance to re-enter the stopped out stocks on a re-breakout or breakdown. If I'm right and this is only a pause, the breakouts will come again.
Tomorrow Alan Greenspan speaks, and everyone will be listening. If his speech hints toward more interest rates hikes the markets will fall back into it's most recent base. If the volume increases, and the market can't hold inside that base, we're headed for the May low, in my opinion of course.
If this rally proves to have been a bear market rally, then the market has formed the left side of what I believe will be a double bottom pattern. In any case, I'll be ready after tonight, even though I should've been ready already, to capitalize on the downturn.
If you have to remember anything, remember the following:
Cut you losses short. Let your winners run, not your losers.
Friday, July 14, 2000
Exodus Communication - EXDS
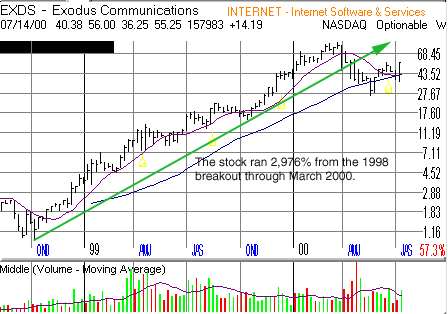
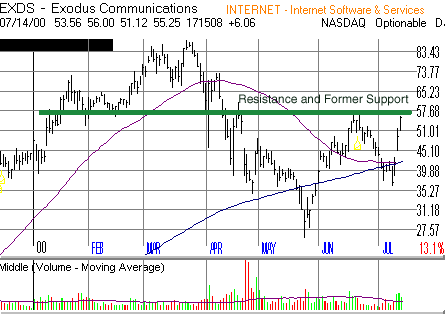
This was one of the hottest stocks from October 1998 through March of 2000. The stock ran 2,976% in that time period, before peaking in Mid March 2000. As the Nasdaq dropped nearly 40%, EXDS crashed 70%. Since then the stock has managed to recover some of its losses but is still well below its all time high. So is this the time to buy?
Looking at the chart pattern, I can't say anything positive about this once upon on a time leader. Some investors would say the stock is in the process of forming the handle of a cup and handle pattern, but I beg to differ. One, the stock is still running into resistance at its mid level of 57 1/2, and second, the stock needs to be closer to its high. However, if the stock were to move through 58 on a short term basis, it may rally to 65, it's next resistance level. After that the stock may run into more resistance at 73 and 85, as disgruntled investor who bought at the peak, start to unload their shares at the first chance to break even.
If the stock can continue to 85 or just below, and consolidate their for a few weeks, then I would call it a cup and handle, and be looking for a breakout on high volume to new highs.
Investors can put their alerts at 57 1/2 for a potential breakout to the next level, but keeping their stops 7% below their purchase price, as this stock is very volatile, and I'm not yet convinced that it can make it to the top to form a handle, just yet.
Wednesday, July 12, 2000
That's What We Were Looking For
What a beautiful day on Wall St. Today. The sun was shining, the wind was blowing, and the market took off like a rocket from Cape Canaveral.
After yesterday's major distribution day on the NASDAQ, doubt was starting to cast in if the NASDAQ was going to be able to pull itself out of this congestion to the upside. The market opened higher on high volume, proceeded to move higher after Greenspan's comments, but reversed course and headed lower to close down for the day on heavy volume. The only saving grace, again, was the breadth, which was positive on the NYSE, and slightly negative on the NASDAQ, suggesting underlying strength. As has been the case since the bottom in May, the market was being supported by small and mid cap stocks, while, unfortunately for the heavy weighting, the large caps were putting pressure on the indexes.
On Wednesday, volume and price increased on all 3 major indexes from the prior day, logging a day of accumulation. New high's and up volume significantly outpaced new low's and down volume.
The NASDAQ cracked it's 50% retracement area with a vengeance, which we needed to do to clear the skies for take off. Next destination, 4,500.
 The question now is, can we follow through with price and volume tomorrow or Friday. Don't be surprised if the market takes a breather or pulls back, hopefully on lower volume. If the NASDAQ acts well, and Friday's economic numbers are favorable, 4,500 may come quicker then we all think. But don't forget, there still is a downside. And the market can just decide to show us what the basement looks like.
Friday's economic release's are going to be critical, and will set the markets mood for the rest of the month. The PPI, capacity utilization, and retail sales are scheduled to be released in the morning. The markets comfort with the soft landing scenario could spell trouble if there are any signs of a pick-up in strength or inflation.
Earnings season is in full swing, and there is no reason to expect anything but strong reports. Unlike the last earnings season, the market is set to rally and take every stock that reports good earnings higher with it. But don't be the company that disappoints, or you know the drill, off with the head!!! Even as expected earnings will receive a reception on the street. The cops busted up the party in March/April, and now we want to party again!!! Only the economic reports could change this mood.
Use tomorrow as a preparation day for Friday. Prepare two lists, stocks setting to breakout or breakdown. Come Friday, whip out the list that favors the direction of the market, and execute your plan.
If you have to remember anything, remember the following:
Cut you losses short. Let your winners run, not your losers.
After yesterday's major distribution day on the NASDAQ, doubt was starting to cast in if the NASDAQ was going to be able to pull itself out of this congestion to the upside. The market opened higher on high volume, proceeded to move higher after Greenspan's comments, but reversed course and headed lower to close down for the day on heavy volume. The only saving grace, again, was the breadth, which was positive on the NYSE, and slightly negative on the NASDAQ, suggesting underlying strength. As has been the case since the bottom in May, the market was being supported by small and mid cap stocks, while, unfortunately for the heavy weighting, the large caps were putting pressure on the indexes.
On Wednesday, volume and price increased on all 3 major indexes from the prior day, logging a day of accumulation. New high's and up volume significantly outpaced new low's and down volume.
The NASDAQ cracked it's 50% retracement area with a vengeance, which we needed to do to clear the skies for take off. Next destination, 4,500.
 The question now is, can we follow through with price and volume tomorrow or Friday. Don't be surprised if the market takes a breather or pulls back, hopefully on lower volume. If the NASDAQ acts well, and Friday's economic numbers are favorable, 4,500 may come quicker then we all think. But don't forget, there still is a downside. And the market can just decide to show us what the basement looks like.
Friday's economic release's are going to be critical, and will set the markets mood for the rest of the month. The PPI, capacity utilization, and retail sales are scheduled to be released in the morning. The markets comfort with the soft landing scenario could spell trouble if there are any signs of a pick-up in strength or inflation.
Earnings season is in full swing, and there is no reason to expect anything but strong reports. Unlike the last earnings season, the market is set to rally and take every stock that reports good earnings higher with it. But don't be the company that disappoints, or you know the drill, off with the head!!! Even as expected earnings will receive a reception on the street. The cops busted up the party in March/April, and now we want to party again!!! Only the economic reports could change this mood.
Use tomorrow as a preparation day for Friday. Prepare two lists, stocks setting to breakout or breakdown. Come Friday, whip out the list that favors the direction of the market, and execute your plan.
If you have to remember anything, remember the following:
Cut you losses short. Let your winners run, not your losers.
Monday, July 10, 2000
NASDAQ - Where To Now?
Well, the unemployment report, coupled with the flat base the NASDAQ has formed over the last 3 weeks, provided the powerful move we saw in the index on Friday. Now the question remains, can the NASDAQ continue to move forward?
Friday's move came on heavier volume than Thursday's, so another day of accumulation, a day in which a major index or stock closes higher and is accompanied by heavier volume than the prior day, occurred. But the volume action wasn't as spectacular as was the action after the last unemployment report on June 2nd, where volume registered 2 billion shares. Several reasons can account for this. First, we're in the midst of summer and allot of traders and portfolio manager take their vacation time during these 3 months. Second, many of the speculators that were around earlier in the year were either wiped out by the March/April correction, or are just to afraid to re-enter the market.
The NASDAQ is also having trouble getting through it's 50% re-tracement area of 4,088, measured by taking the all-time high, subtracting the low reached during this correction and dividing by 2. This is now the critical area to watch. If we can break the this level decisively on heavier volume, the NASDAQ should be able to proceed to the 4,500 area, the site of the breakdown from the double top it formed in March.
 If anyone has been paying attention, there has been a rotation out of large cap stocks to small and medium sized companies. The problem with this type of rotation is that even though the underlying market is healthy, the indexes can still go down, since these companies do not have the market weighting to drive the market significantly higher. Any major move in the market is typically driven with the help of large caps. Advancers beating out decliners, and new highs outstripping new lows have accompanied the last few down days in the NASDAQ. This is healthy as it shows that smaller to middle cap stocks are outperforming the large caps. Also, check the performance of the Russell 2000. The index is up for the year, which confirms what I'm saying. If anyone remembers, the move the NASDAQ made from last year through March, the majority of the time decliners outpaced advancers by a wide margin. The large caps command such a high weighting, less of them have to advance for the market to move.
The point: don't let a minor market downturn scare you. Keep looking for stocks that are basing particularly in the small and mid cap area, but don't overlook the large caps. They could come roaring back at anytime. The market is buying stocks that are reasonably valued and have earnings to back up the valuations. The days of 'buy the story' are over for now. If you're still in a story stock, that's free falling, get out. There's no reason why it can't keep falling.
If you have to remember anything, remember the following:
Cut you losses short. Let your winners run, not your losers.
Friday's move came on heavier volume than Thursday's, so another day of accumulation, a day in which a major index or stock closes higher and is accompanied by heavier volume than the prior day, occurred. But the volume action wasn't as spectacular as was the action after the last unemployment report on June 2nd, where volume registered 2 billion shares. Several reasons can account for this. First, we're in the midst of summer and allot of traders and portfolio manager take their vacation time during these 3 months. Second, many of the speculators that were around earlier in the year were either wiped out by the March/April correction, or are just to afraid to re-enter the market.
The NASDAQ is also having trouble getting through it's 50% re-tracement area of 4,088, measured by taking the all-time high, subtracting the low reached during this correction and dividing by 2. This is now the critical area to watch. If we can break the this level decisively on heavier volume, the NASDAQ should be able to proceed to the 4,500 area, the site of the breakdown from the double top it formed in March.
 If anyone has been paying attention, there has been a rotation out of large cap stocks to small and medium sized companies. The problem with this type of rotation is that even though the underlying market is healthy, the indexes can still go down, since these companies do not have the market weighting to drive the market significantly higher. Any major move in the market is typically driven with the help of large caps. Advancers beating out decliners, and new highs outstripping new lows have accompanied the last few down days in the NASDAQ. This is healthy as it shows that smaller to middle cap stocks are outperforming the large caps. Also, check the performance of the Russell 2000. The index is up for the year, which confirms what I'm saying. If anyone remembers, the move the NASDAQ made from last year through March, the majority of the time decliners outpaced advancers by a wide margin. The large caps command such a high weighting, less of them have to advance for the market to move.
The point: don't let a minor market downturn scare you. Keep looking for stocks that are basing particularly in the small and mid cap area, but don't overlook the large caps. They could come roaring back at anytime. The market is buying stocks that are reasonably valued and have earnings to back up the valuations. The days of 'buy the story' are over for now. If you're still in a story stock, that's free falling, get out. There's no reason why it can't keep falling.
If you have to remember anything, remember the following:
Cut you losses short. Let your winners run, not your losers.
Friday, July 07, 2000
Quaaaaaaalcommmmmmm!!!!
No that's not the call of praise, that's what the company sounds like falling off a cliff. So what happened to Qualcomm? Suddenly it's not worth the paper the certificates are printed on. The so called King of wireless looks more like king of peasants. Korea is reported to be choosing a rivals CDMA technology, China's biggest telecom is delaying the use of CDMA, & Brazil may be going to GSM. This isn't the way it was supposed to happen. CDMA is the best? Isn't it? Remember, the best doesn't always win. Just ask Sony or Xerox. No longer does it look like QCOM will take the world by storm and garner 80% of the market tomorrow. Suddenly the company needs to go through the growing pains every other company goes through to deserve a high market cap and multiple. I told you!!!!! Nah, nah, nah, nah, nah!!!! Had to get that out to all those investor who called me stupid when I told them at 200, even 150 that QCOM will crash, and crash hard. These investors were telling me that QCOM was worth every penny at 200, and that the stock would triple from there. It was the next Microsoft or Cisco. Hello, anyone home? At it's high's the stock was trading at a market cap of $150 Billion. Yes, Billion. That was 1/2 of MSFT and 1/3 of CSCO market cap. Are you kidding me? Those stocks took over a decade to reach those market caps, and have steady revenues and earnings to back it up. Enough, my blood pressure is rising over how much money these individuals lost. If you plan on holding on to those shares, good luck. But I think it'll be several years before you see your investment back. What lesson should we learn from this? Learn to recognize when the stocks price no longer reflects the reasonable value of a company. At that point trade it accordingly. But don't make excuses for why you should hold as it starts to fall of the cliff.
If you have to remember anything, remember the following:
Cut you losses short. Let your winners run, not your losers.
If you have to remember anything, remember the following:
Cut you losses short. Let your winners run, not your losers.
Keithley Instruments - KEI
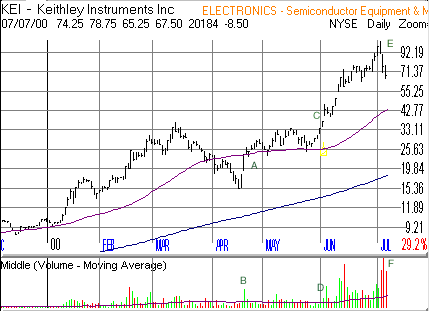 The stock of the week is Keithley Instruments (KEI). Back in early March to Mid April the Nasdaq fell close to 40%. A bright star on the horizon was setting up one of the most explosive set ups, the famous William J. O'neil cup with handle. As the market rallied on 4/19/00 institutions bid up KEI almost 6 points (A) on over twice the average volume (B). As the market began tradeing sideways for four weeks, KEI gaps (C) out of it's base on over triple average volume (D) to a new record high. The stock then ran 221% over the next four weeks, until it reversed course on 7/5/00 (E) on heavy volume (F), and followed through to the downside on 7/6/00 on even heavier volume. This reversal is interesting as KEI is the leader in the Electronic - Instruments group. This breakdown could be a precursor to the action of other stocks within this group. Either new leadership will evolve within this group or a new group will come to the forefront.
Thursday, July 06, 2000
NASDAQ - Exhausted Market, But Ready To Take Off
Of course the market is exhausted. It had run 33.88% from its' May Low's. The sideways movement is healthy for the market. It's allowing it to work off the excess part of the run (a.k.a Shakeout the weak holders) before possibly resuming its' way up.
After experiencing the March and April drops, you'd think investors would be happy with the sideways movement, rather than a sudden drop, that disintegrates their portfolio's in a matter of days. But they complain when the market is down, they complain when the market moves sideways, and they only cheer when the market is up. All part of human nature. What these complaining investors are missing, is the opportunity to be on the lookout for new breakouts or breakdowns. As this market moves sideways, various stocks, from old to possibly new leaders, are completing their bases. Either to explode to the upside or downside.
Today's action was positive as the market marked another day of accumulation, after yesterdays distribution day. The market is set up for tomorrow's unemployment report. The three week base the NASDAQ has formed, will act as a launching pad either up or down, depending on what the unemployment report has to say. Tonight is a good night to review your portfolio for stocks that might be on the verge of breaking down, in case the report is negative. It's also a good night to look for stocks ready to breakout or breakdown. If you make this list, no matter which way the report goes tomorrow, you'll be ready to take advantage of the move.
If you have to remember anything, remember the following:
Cut you losses short. Let your winners run, not your losers.
After experiencing the March and April drops, you'd think investors would be happy with the sideways movement, rather than a sudden drop, that disintegrates their portfolio's in a matter of days. But they complain when the market is down, they complain when the market moves sideways, and they only cheer when the market is up. All part of human nature. What these complaining investors are missing, is the opportunity to be on the lookout for new breakouts or breakdowns. As this market moves sideways, various stocks, from old to possibly new leaders, are completing their bases. Either to explode to the upside or downside.
Today's action was positive as the market marked another day of accumulation, after yesterdays distribution day. The market is set up for tomorrow's unemployment report. The three week base the NASDAQ has formed, will act as a launching pad either up or down, depending on what the unemployment report has to say. Tonight is a good night to review your portfolio for stocks that might be on the verge of breaking down, in case the report is negative. It's also a good night to look for stocks ready to breakout or breakdown. If you make this list, no matter which way the report goes tomorrow, you'll be ready to take advantage of the move.
If you have to remember anything, remember the following:
Cut you losses short. Let your winners run, not your losers.
Sunday, April 30, 2000
NASDAQ - Falling From The Sky
The Nasdaq has been in a downtrend for 5 weeks now and investors are wondering when the blood bath in tech stocks is going to end. Tech stocks in general have been the most volatile stocks, but over the long term they have been the best performing group. The question on all investor’s minds right now is, do we buy in or do we wait for a solid bottom formation?
The Fibanochi Theory is one of the better tools for correction measurement. The Theory states that a major correction, 20% plus, will retrace at least 50% of a rally’s move. If that support is broken, then it’s heading for a 67%, 87%, 95%, and finally 100% retracement of the rally.
The current rally ended on March 10th, at a high of 5,133, started on October 18, 1998, on which day the NASDAQ bottomed at 1,344, from a major correction. Using the Fibanochi Theory, the NASDAQ's support levels are 3,238, 2,594, 1,837, 1,533, & 1,344. These support levels are found by subtracting the low from the high of the NASDAQ, applying the percentage correction, and subtracting the result from the high. Each time the NASDAQ pierces through one of these support levels, the next support will most likely be tested. On April 14th, the NASDAQ tested and quickly bounced higher off the first support level at around 3,238, and started a rally. The rally was confirmed on April 25th, when all the major indexes rallied more than 1% on higher volume from the prior day, but below average vloume.
Besides looking for support levels, the public's bullishness or bearishness should be examined. If everyone is optimistic, and believes the markets are headed higher, chances are they're wrong. As of this writing, the optimism in the markets was extremely high. In fact, fear hasn't even factored its way into the equation. The belief among most investors, is that this market will pull them out of this jam. Analyst’s are also jumping on this bandwagon, and proclaiming the bear market over. The funny part, these same guys said the previous correction a week before was the bottom. This overall optimism is bearish for the market.
Even though the market has bounced off a key support level, the current rally confirmed, and the optimism high, bear market don't usually end so quickly, especially when optimism is so high, and confirmation of rallies happen on below average volume. But if you're intent on putting your money to work, look for sectors that are exhibiting strength. One such sector is the semiconductor sector. Stocks such as AMAT, NVLS, AMD, MU, and others are near or at their all time highs. These stocks are also exhibiting strong fundamentals. The key to buying these stocks is to keep stop losses close to breakout points. If the current rally fails, these stocks could fall sharply along with the market.
As you can see the signals at this time are extremely mixed. If you have to buy, then buy cautiously. Investors at this time should be focusing on preserving capital and making a buy list for the next bull market. Until then, be patient.
The Fibanochi Theory is one of the better tools for correction measurement. The Theory states that a major correction, 20% plus, will retrace at least 50% of a rally’s move. If that support is broken, then it’s heading for a 67%, 87%, 95%, and finally 100% retracement of the rally.
The current rally ended on March 10th, at a high of 5,133, started on October 18, 1998, on which day the NASDAQ bottomed at 1,344, from a major correction. Using the Fibanochi Theory, the NASDAQ's support levels are 3,238, 2,594, 1,837, 1,533, & 1,344. These support levels are found by subtracting the low from the high of the NASDAQ, applying the percentage correction, and subtracting the result from the high. Each time the NASDAQ pierces through one of these support levels, the next support will most likely be tested. On April 14th, the NASDAQ tested and quickly bounced higher off the first support level at around 3,238, and started a rally. The rally was confirmed on April 25th, when all the major indexes rallied more than 1% on higher volume from the prior day, but below average vloume.
Besides looking for support levels, the public's bullishness or bearishness should be examined. If everyone is optimistic, and believes the markets are headed higher, chances are they're wrong. As of this writing, the optimism in the markets was extremely high. In fact, fear hasn't even factored its way into the equation. The belief among most investors, is that this market will pull them out of this jam. Analyst’s are also jumping on this bandwagon, and proclaiming the bear market over. The funny part, these same guys said the previous correction a week before was the bottom. This overall optimism is bearish for the market.
Even though the market has bounced off a key support level, the current rally confirmed, and the optimism high, bear market don't usually end so quickly, especially when optimism is so high, and confirmation of rallies happen on below average volume. But if you're intent on putting your money to work, look for sectors that are exhibiting strength. One such sector is the semiconductor sector. Stocks such as AMAT, NVLS, AMD, MU, and others are near or at their all time highs. These stocks are also exhibiting strong fundamentals. The key to buying these stocks is to keep stop losses close to breakout points. If the current rally fails, these stocks could fall sharply along with the market.
As you can see the signals at this time are extremely mixed. If you have to buy, then buy cautiously. Investors at this time should be focusing on preserving capital and making a buy list for the next bull market. Until then, be patient.
Friday, April 14, 2000
NASDAQ's Fall From Peak
The market is no longer acting in its typical fashion. The market's leading tech stocks are falling off cliffs, and the buy on the dip rule is no longer working. On March 10th the NASDAQ put in a major top and has been in a free fall ever since. The DOW is now quickly following suit. The market was moving up so fast, that everyone was talking about becoming an overnight millionaire. What's even more mind boggling, is that The Bergen Record, a major newspaper, had a 14 year old kid on the front page throwing darts at internet stocks and making thousands of dollars.
The health of the market's leading stocks, EMLX, JDSU, MSTR, etc., which are its lifeline, is the most important factor to look at when determining a market top. These leading stocks have fallen 30+%, and will need several months, years, or even longer, if ever to recover. These so called "New Economy Stocks" with no earnings or even a proven business model are being punished for their extreme, irrational valuations.
The next important factor to look at, is the health of the overall market. The one thing that I learned through investing, is to let the market tell the story. The Nasdaq has setup a beautiful Head and Shoulders pattern which is the most bearish and the most devastating pattern there is. On Feb 11th, the Nasdaq setup the first shoulder at 4300. On March 10th, the NASDAQ formed the head at 5200. And on April 7th, the NASDAQ formed the right shoulder at 4300. The confirmation of the pattern came on April 13 when the neckline, which was at 3750, was sliced through on heavy volume, like a hot knife through butter. We are currently at 3321, and based on recent history, the market looks poised to test the next support level at 2700. If we break the 2700 level, the composite will head further down to test the 2200 - 2400 levels. I won't even get into what will happen if the NASDAQ slices through the latter support level.
The health of the market's leading stocks, EMLX, JDSU, MSTR, etc., which are its lifeline, is the most important factor to look at when determining a market top. These leading stocks have fallen 30+%, and will need several months, years, or even longer, if ever to recover. These so called "New Economy Stocks" with no earnings or even a proven business model are being punished for their extreme, irrational valuations.
The next important factor to look at, is the health of the overall market. The one thing that I learned through investing, is to let the market tell the story. The Nasdaq has setup a beautiful Head and Shoulders pattern which is the most bearish and the most devastating pattern there is. On Feb 11th, the Nasdaq setup the first shoulder at 4300. On March 10th, the NASDAQ formed the head at 5200. And on April 7th, the NASDAQ formed the right shoulder at 4300. The confirmation of the pattern came on April 13 when the neckline, which was at 3750, was sliced through on heavy volume, like a hot knife through butter. We are currently at 3321, and based on recent history, the market looks poised to test the next support level at 2700. If we break the 2700 level, the composite will head further down to test the 2200 - 2400 levels. I won't even get into what will happen if the NASDAQ slices through the latter support level.
 The DOW, which was holding up better than the nasdaq because the stocks in it are considered safe havens during market turmoil, has also turned down. It is currently in the process of forming a huge head and shoulder pattern. The left shoulder occurred in December of 1999 between 11,200 - 11,300, the head formed on January 14th at 11,700, and the right shoulder recently occurred on April 7th. If the DOW breaks its neckline/support at 9700, it will most likely head down to test its support level at 9000. If 9000 is broken, it may make an attempt to test the 7400 level.
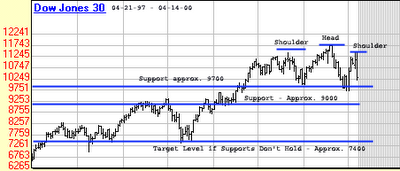
Another two important contrarian indicators to look at are the Bull/Bear and Put to Call Ratios. The Bull/Bear Ratio measures the amount of people that are Bullish and Bearish on the market. The higher the Bullish percentage is over the Bearish one, the more Bearish the indicator gets, and vice versa. The reasoning for this is, that if most people are Bullish, then they're fully invested, and don't have more cash to support current levels. Currently the Bull/Bear ratio is 58%/27% which is very Bearish.
The Put to Call Ratio measures the amount of Puts, people betting against the market, that are being purchased versus the amount of Calls, people betting that the market will rise. The reasoning behind this indicator is that 95% of all option players lose all their money (A proven fact). So if most people are buying calls, most likely they are wrong. This indicator can hang around at a low or high level for some time before the market turns in the opposite direction, but it's a good indicator that a short term market top or bottom may be around. Before today, the put/call ration was hovering under 0.5, which is very Bearish.
The last time people were this Bullish on the market was back in the 1920's, and we all know what happened then. Remember, the only way to make money in the market is to be patient, unemotional, let your winners run, but don't let the profit slip away, and cut your losses quickly. Go now, look at your portfolios, and decide which stocks need to be sold. Don't let the fact the you're losing money guide your decisions. If you're in cash when the market finally turns northward, you will have a chance to make money. But if you're still invested in some of the heavily beaten down stocks, it may be sometime before you ever see your original investment. Good luck in the weeks to come.
Tuesday, February 01, 2000
Why are you running away, asked the DOW of the NASDAQ?
A huge divergence has developed between the movement of the DOW and NASDAQ. The Dow is well below its 200 day moving average, and had broken below its psychological 10,000 level, while the NASDAQ is well above its 200 day moving average, and continues to make all time highs. After years of being told to invest in index funds because the majority of mutual funds couldn't outperform the index, in turn sending the indexes to record valuations, investors have started pulling their money out of index funds, and rolling the dice on tech stocks, in turn sending the NASDAQ on a express train to the moon.
When this amazing ride will end, is anyones guess. If anyone tells you that they have it figured out, they're lying. The run has stupefied the best of investor, as well as any financial or economic model. The market doesn't care about the quality of the company, just that they're involved in one of the hot sectors. What we've entered into is a full blown momentum market. The way a momentum market works is like this: Stocks move because someone's buying them, and someone else is willing to buy the stock at a higher price, and then at an even higher price, and then sell it at an even higher price. As you see this can go on indefinitely, until there's no left to buy, and then CRASH!!!!
Once the party ends, the gap between the indexes will close. People will flock out of these ridiculously valued tech stocks, and back into value. At which time we will see a tech correction like no other. But the bull market will continue, as investor rush back into the value stocks. There is too much money out there floating around for the bull to stop charging.
In the meantime, enjoy the day trading. But don't, and I can't stress this enough, don't buy into these issues for the long-term. A company like JDSU, which is selling at about 1/4 the value of CSCO, isn't worth $100 billion, with sales of less then $1 billion. Yes, they have the technology that's in hot demand, but they're not the only ones. In fact CSCO, LU, and some other big players are starting to get into their business. Remember, it took CSCO, with $16 billion in sales, 10 years to earn its valuation, and that was after years of proving it can consistent revenue and earnings growth. It has taken JDSU 1 year, with barely a history. At this pace, JDSU will surpass CSCO's market cap by the end of the year. I think we can all agree, that would be irrational. Don't get me wrong, JDSU will be around for a long time, but your long term investments will be served better elsewhere. In the meantime enjoy trading JDSU, it can make you a lot of money if timed correctly.
The NASDAQ should continue to march right on in March, while the remaining 1999 IRA contributions and bonuses pour into it. Once that liquidity dries up, we will get the long awaited correction in the NASDAQ, but look for the DOW to rise, as investors temporarily look for a place to park their cash, until the NASDAQ express is back up and running.
When this amazing ride will end, is anyones guess. If anyone tells you that they have it figured out, they're lying. The run has stupefied the best of investor, as well as any financial or economic model. The market doesn't care about the quality of the company, just that they're involved in one of the hot sectors. What we've entered into is a full blown momentum market. The way a momentum market works is like this: Stocks move because someone's buying them, and someone else is willing to buy the stock at a higher price, and then at an even higher price, and then sell it at an even higher price. As you see this can go on indefinitely, until there's no left to buy, and then CRASH!!!!
Once the party ends, the gap between the indexes will close. People will flock out of these ridiculously valued tech stocks, and back into value. At which time we will see a tech correction like no other. But the bull market will continue, as investor rush back into the value stocks. There is too much money out there floating around for the bull to stop charging.
In the meantime, enjoy the day trading. But don't, and I can't stress this enough, don't buy into these issues for the long-term. A company like JDSU, which is selling at about 1/4 the value of CSCO, isn't worth $100 billion, with sales of less then $1 billion. Yes, they have the technology that's in hot demand, but they're not the only ones. In fact CSCO, LU, and some other big players are starting to get into their business. Remember, it took CSCO, with $16 billion in sales, 10 years to earn its valuation, and that was after years of proving it can consistent revenue and earnings growth. It has taken JDSU 1 year, with barely a history. At this pace, JDSU will surpass CSCO's market cap by the end of the year. I think we can all agree, that would be irrational. Don't get me wrong, JDSU will be around for a long time, but your long term investments will be served better elsewhere. In the meantime enjoy trading JDSU, it can make you a lot of money if timed correctly.
The NASDAQ should continue to march right on in March, while the remaining 1999 IRA contributions and bonuses pour into it. Once that liquidity dries up, we will get the long awaited correction in the NASDAQ, but look for the DOW to rise, as investors temporarily look for a place to park their cash, until the NASDAQ express is back up and running.
Monday, December 06, 1999
December 1999 Market Update
The month started off on a good note with the unemployment report. U.S. unemployment had dropped to 4.1%, the economy had added 310,000 new jobs, while the all important hourly wages number came in at a less then expected 0.1%. The Producer Price Index (the "PPI"), which measures inflation on the producer level, dropped 0.1%, while the core PPI, which excludes food and energy prices was up 0.3%. The Consumer Price Index (the "CPI"), which measures inflation on the consumer level, rose 0.2%. Productivity, a measure of the relationship between units produced versus cost to produce them, showed a strong gain of 4.2%. The other key economic indicator GDP, which measures economic growth, rose 5.5%. By now your asking what all these numbers mean. The numbers reaffirm the view of strong economic growth with low inflation, which bodes well for the stock market.
The Federal Open Market Committee meeting went as expected. The Fed raised rates for the third time this year, and adopted a neutral bias. The market reacted positively, assuming that the Fed was done raising rates for the remainder of the year. The yield on the long bond dropped on the news only to rise back to it's recent high's by the end of the month. The rising yield could prove problem some to the market, as it would jeopardize the third component of the new economy theory, strong growth, low inflation and interest rates.
December should prove to be an interesting month. Investors will have to grapple with the decision on whether to buy or sell in anticipation of Y2K. The end of the month will bring the start of earning warning season, and of course there is the FOMC meeting. The key economic indicators to watch are employment and wage inflation indicators. Some Fed officials have indicated that wage inflation is the indicator they're watching most closely. The reason, increasing wages needs to be passed through somewhere, and theirs three ways to do it. The best way is through productivity gains. The two worst ways, is by absorbing the costs internally, which will cause earnings to suffer, or passing it through to the consumer which would cause a rise in inflation. The first of the important indicators for December, the wage inflation number in the unemployment report, came in again at a lower than expected 0.1%, helping the market rally. Still showing that wages aren't creating inflationary pressure. The CPI and PPI are, as always also important to watch.
The NASDAQ should also be watched carefully. It is up over 60% for the year, and doesn't seem to be coming to rest anytime soon. But inevitably it will correct, and many of the high flyers that have helped the NASDAQ rise in the recent leg up, will suffer significantly. Investors should take some, not all, money off the table in some of these high fliers. This way, investors will be ready to take advantage of lower prices when a correction does take place.
Continue investing your money, especially in high tech stocks that have been effected by the Y2K spending slowdown. These companies will bounce back after the beginning of the year, once investors realize that the slowdown was due to one quarter event related to Y2K, rather than a slowdown in business. The Fed will leave rates and their bias unchanged, thanks to favorable economic news that have shown low inflation growth.
The Federal Open Market Committee meeting went as expected. The Fed raised rates for the third time this year, and adopted a neutral bias. The market reacted positively, assuming that the Fed was done raising rates for the remainder of the year. The yield on the long bond dropped on the news only to rise back to it's recent high's by the end of the month. The rising yield could prove problem some to the market, as it would jeopardize the third component of the new economy theory, strong growth, low inflation and interest rates.
December should prove to be an interesting month. Investors will have to grapple with the decision on whether to buy or sell in anticipation of Y2K. The end of the month will bring the start of earning warning season, and of course there is the FOMC meeting. The key economic indicators to watch are employment and wage inflation indicators. Some Fed officials have indicated that wage inflation is the indicator they're watching most closely. The reason, increasing wages needs to be passed through somewhere, and theirs three ways to do it. The best way is through productivity gains. The two worst ways, is by absorbing the costs internally, which will cause earnings to suffer, or passing it through to the consumer which would cause a rise in inflation. The first of the important indicators for December, the wage inflation number in the unemployment report, came in again at a lower than expected 0.1%, helping the market rally. Still showing that wages aren't creating inflationary pressure. The CPI and PPI are, as always also important to watch.
The NASDAQ should also be watched carefully. It is up over 60% for the year, and doesn't seem to be coming to rest anytime soon. But inevitably it will correct, and many of the high flyers that have helped the NASDAQ rise in the recent leg up, will suffer significantly. Investors should take some, not all, money off the table in some of these high fliers. This way, investors will be ready to take advantage of lower prices when a correction does take place.
Continue investing your money, especially in high tech stocks that have been effected by the Y2K spending slowdown. These companies will bounce back after the beginning of the year, once investors realize that the slowdown was due to one quarter event related to Y2K, rather than a slowdown in business. The Fed will leave rates and their bias unchanged, thanks to favorable economic news that have shown low inflation growth.
Monday, November 15, 1999
The Fed & Y2K - Who Cares? And What To Do?
The Fed will meet tomorrow on the direction of interest rates. The majority of the economic indicators since the last Fed meeting has shown a strong economy with low inflation, which bodes well for the stock market. The only indicator that showed any inflation was the Producer Price Index (the "PPI") in October when it jumped 1.1%, mainly due to a one time spike in tobacco prices and oil. The November core PPI, which came in above expectations at 0.3%, almost proved problematic, but the higher than expected gain in productivity, of 4.2%, negated the spike in the PPI, at least temporarily. Basically, companies are still able to squeeze out efficiencies in production, using the savings to offset any increase in raw materials, and keeping their own selling prices stable.
So what’s the fed to do? They don’t want to over raise interest rates and abruptly end the current expansion, but they also don’t want to sit on the sidelines and possibly watch inflation run amok. In my opinion, I think they should raise interest rates one more time, taking away the last of the three interest rate cuts they gave us at the end of last year. Even though most economic indicators are showing benign inflation, productivity gains that up to now have been able to offset any type of inflationary pressure, cannot continue to increase at the breakneck pace of the last few years. Economies around the world are beginning to recover from the 1997 – 1998 crisis, and demand for products is bound to pick-up putting pressure on capacity, which in turn would put pressure on prices as companies scramble to build additional production capacity.
So how’s the market going to react? Whether the Fed raises or leaves rates alone, the market will react positively and focus on the Fed’s interest rate bias going forward. The market has already discounted a 25 basis point hike, in fact just a month ago the market was discounting a 50 basis point hike, and that’s why we got the recent rally, because the discounted expectation changed. If the Fed raises interest rates, than the market will take it as a sign of a vigilant Fed, that is out squash inflation, and that we are done with further rate increases for the time being, which will be a positive for the market. If the Fed leaves rates unchanged than the market will have to UN-discount the 25 basis point hike, creating a rally. But the latter could prove to be risky, from a market and economic standpoint. As long as economic data continues to show strong growth with low inflation, the market will continue to rally, but the minute even the slightest signs of inflation show up, the market will begin to worry about the next Fed meeting. The former will allow for a cushion as far inflation is concerned, since it will take time for the rate hike to work it’s way through the economy, the market would be willing to live with a short term spike in inflation, assuming that the last hike will work to slow the economy down in the months to follow.
So how do you play tomorrow? As far as I’m concerned, buy those quality stocks you’ve been eyeing. If I’m right, they may get away from you quickly. And if you’re still worried about the market's reaction, but don’t want to miss out on a sudden move up, then commit 25 – 50% of the funds before the meeting, and the rest after. The initial reaction might be negative to either move, but the result should prove to be positive.
So what about Y2K? I’ve been drilled on this one. Do I sell everything and wait, do I short everything, or do I do nothing? If you’re holding stocks or mutual funds now, do nothing, but if you’ve got available cash then you can play both the long and the short side of the market for Y2K. Just remember one thing, the market usually discounts prices well ahead of fact.
I believe any major move to the downside in the market because of Y2K has been discounted already. Anyone who has wanted to sell, because of Y2K, most likely has sold already, except for a few stragglers, who’ll most likely do their selling in December. Barring any major Y2K issues, the latter sales will prove to be the bottom, rather than the top to the middle. Of course, if the Soviet nuclear arsenal launches a few nukes towards the US accidentally, the December sellers would prove to be geniuses, only problem, will anyone be left to buy stock from in January?
So how do I go long? It’s quite simple. Find solid companies that have seen a slowdown in sales because of Y2K spending freezes, and buy them. Two companies that come to mind are IBM and Unisys (UIS). Neither company has experienced a slowdown in sales because their products are becoming obsolete, or because competitors are slashing prices, but because most major corporations that these two deal with aren’t spending a dime on IT products until after Y2K. So the lost sales in the fourth quarter will most likely be made up in the first quarter of 2000. The only fundamental change here is that timing of sales has shifted from one quarter to another.
Now how about the short side? I don’t like shorting stocks, because it goes against the basic theory of the stock market, buy low sell high. But if you insist, look for companies in the basic necessity product area. These companies may experience the opposite effect of technology companies. People and companies might stock pile their products, creating enormous demand and inventory build-up in the fourth quarter, which may take through the first half of 2000 to deplete, putting pressure on year 2000 earnings.
Any downside move in the market after tomorrow will most likely be caused by a necessary correction for the NASDAQ rather than anything associated with these two events. Any spook because of Y2K in the next month that sends the market down should be looked upon as a buying opportunity rather than a time to bail. Of course, looking for ways to hedge your portfolio never hurts, but maintaining a 100% cash balance is a poor hedge, especially in a market that has proven to be resilient to a prolonged correction.
So what’s the fed to do? They don’t want to over raise interest rates and abruptly end the current expansion, but they also don’t want to sit on the sidelines and possibly watch inflation run amok. In my opinion, I think they should raise interest rates one more time, taking away the last of the three interest rate cuts they gave us at the end of last year. Even though most economic indicators are showing benign inflation, productivity gains that up to now have been able to offset any type of inflationary pressure, cannot continue to increase at the breakneck pace of the last few years. Economies around the world are beginning to recover from the 1997 – 1998 crisis, and demand for products is bound to pick-up putting pressure on capacity, which in turn would put pressure on prices as companies scramble to build additional production capacity.
So how’s the market going to react? Whether the Fed raises or leaves rates alone, the market will react positively and focus on the Fed’s interest rate bias going forward. The market has already discounted a 25 basis point hike, in fact just a month ago the market was discounting a 50 basis point hike, and that’s why we got the recent rally, because the discounted expectation changed. If the Fed raises interest rates, than the market will take it as a sign of a vigilant Fed, that is out squash inflation, and that we are done with further rate increases for the time being, which will be a positive for the market. If the Fed leaves rates unchanged than the market will have to UN-discount the 25 basis point hike, creating a rally. But the latter could prove to be risky, from a market and economic standpoint. As long as economic data continues to show strong growth with low inflation, the market will continue to rally, but the minute even the slightest signs of inflation show up, the market will begin to worry about the next Fed meeting. The former will allow for a cushion as far inflation is concerned, since it will take time for the rate hike to work it’s way through the economy, the market would be willing to live with a short term spike in inflation, assuming that the last hike will work to slow the economy down in the months to follow.
So how do you play tomorrow? As far as I’m concerned, buy those quality stocks you’ve been eyeing. If I’m right, they may get away from you quickly. And if you’re still worried about the market's reaction, but don’t want to miss out on a sudden move up, then commit 25 – 50% of the funds before the meeting, and the rest after. The initial reaction might be negative to either move, but the result should prove to be positive.
So what about Y2K? I’ve been drilled on this one. Do I sell everything and wait, do I short everything, or do I do nothing? If you’re holding stocks or mutual funds now, do nothing, but if you’ve got available cash then you can play both the long and the short side of the market for Y2K. Just remember one thing, the market usually discounts prices well ahead of fact.
I believe any major move to the downside in the market because of Y2K has been discounted already. Anyone who has wanted to sell, because of Y2K, most likely has sold already, except for a few stragglers, who’ll most likely do their selling in December. Barring any major Y2K issues, the latter sales will prove to be the bottom, rather than the top to the middle. Of course, if the Soviet nuclear arsenal launches a few nukes towards the US accidentally, the December sellers would prove to be geniuses, only problem, will anyone be left to buy stock from in January?
So how do I go long? It’s quite simple. Find solid companies that have seen a slowdown in sales because of Y2K spending freezes, and buy them. Two companies that come to mind are IBM and Unisys (UIS). Neither company has experienced a slowdown in sales because their products are becoming obsolete, or because competitors are slashing prices, but because most major corporations that these two deal with aren’t spending a dime on IT products until after Y2K. So the lost sales in the fourth quarter will most likely be made up in the first quarter of 2000. The only fundamental change here is that timing of sales has shifted from one quarter to another.
Now how about the short side? I don’t like shorting stocks, because it goes against the basic theory of the stock market, buy low sell high. But if you insist, look for companies in the basic necessity product area. These companies may experience the opposite effect of technology companies. People and companies might stock pile their products, creating enormous demand and inventory build-up in the fourth quarter, which may take through the first half of 2000 to deplete, putting pressure on year 2000 earnings.
Any downside move in the market after tomorrow will most likely be caused by a necessary correction for the NASDAQ rather than anything associated with these two events. Any spook because of Y2K in the next month that sends the market down should be looked upon as a buying opportunity rather than a time to bail. Of course, looking for ways to hedge your portfolio never hurts, but maintaining a 100% cash balance is a poor hedge, especially in a market that has proven to be resilient to a prolonged correction.
Subscribe to:
Posts (Atom)